
HOMER
Software for motif discovery and next-gen sequencing analysis
Finding Significant Interactions in Hi-C Data
HOMER can search for pairs of loci that have a greater
number of Hi-C reads that expected by chance, which below
will be referred to as a 'significant interaction'.
The enhanced proximity of these regions may have relevant
biological interpretation. It is important to note
up front that it is basically unheard of for two loci to
ALWAYS co-localize next to one another (i.e. in same
cross-linked complex). Usually regions simply show
"enrichment" for their co-localization, meaning that
evidence for their co-fixation comes from only a fraction of
the total cells used in the experiment. This also
means that some regions may for 'significant interactions'
with multiple other loci in the same experiment.The section below describes the HOMER commands that can be used to find significant interactions from Hi-C experiments, followed by routines and techniques to analyze their biological significance. The next section describes how to visualize interactions in Circos Diagrams. The section after that describes the analysis of interactions with respect to other features and their annotation. These sections focus on the analysis of specific interactions between any two loci, while the section after that describes the use of Structured Interaction Matrix Analysis (SIMA), which boosts analysis power by considering interactions between multiple regions simultaneously.
Finding Significant Interactions in Hi-C Data
To find significant interactions between any two loci with HOMER, use the analyzeHiC command with the option "-interactions <outputfilename.txt>". This will trigger homer to perform significance calculations between each loci described in the command. For example:
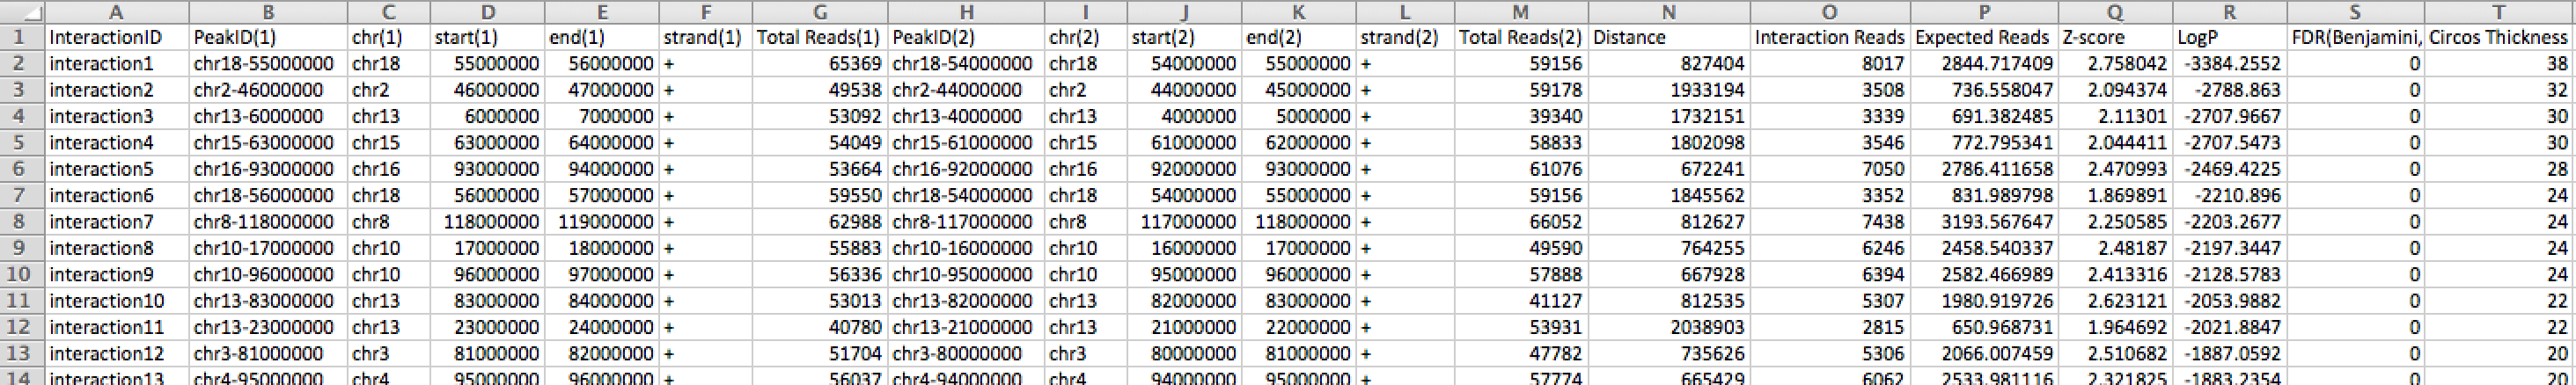
analyzeHiC ES-HiC -res 1000000 -interactions significantInteractions.txt -nomatrixThis command will search for significant interactions in the genome at 1Mb resolution. The "-nomatrix" is optional, but since the default of analyzeHiC is to produce a matrix, you may want (or need) to stop creation of the matrix as it could be very large and consume too much memory. Opening the "significantInteractions.txt" files with Excel will reveal a file that looks like:
This file is formatted as a HOMER interaction file. It is a tab-delimited text file with a header and one interaction per line. The definitions of the columns are as follows:
HOMER Interaction File Format Column Types (tab-separated text file)
1) Interaction ID (must be unique)
2) Peak ID for region 1
3) chr for region 1
4) start position for region 1
5) end position for region 1
6) strand for region 1
7) total reads for region 1
8) Peak ID for region 2
9) chr for region 2
10) start position for region 2
11) end position for region 2
12) strand for region 2
13) total reads for region 2
14) Distance between regions (or "interchromosomal")
15) Interaction Reads (total Hi-C reads connecting the regions)
16) Expected Interaction Reads (total expected Hi-C reads based on background model)
17) Modified Z-score
18) Natural log of the p-value for the interaction (binomial)
19) False Discovery Rate (based on Benjamini correction)
20**) Circos Thickness (used for visualization by Circos)
The interaction file can be further analyzed with commands in the sections below, or it can be the starting point of your own custom analysis.
How HOMER finds Significant Interactions
The premise behind finding significant interactions is simple enough: Look for pairs of regions that have more Hi-C reads between them than would be expected by chance. The expected number of reads is calculated using the background model (covered here). The background model is used to model how many reads we expect to connect to each other region in the genome. If regions are far away (or on separate chromosomes), the we expect only a small number of reads to connect them. Likewise, if two regions are close to one another, we would expect a large number of interactions. These expectations are also dependent on the number of total reads mapping to each locus (which may depend on the number of restriction sites etc. in the region). The background model attempts to take all of these factors into account.
Since the total number of reads per region is fixed (and more or less constant for each region due to the unbiased nature of Hi-C), we test how these reads are distributed relative to the expectation. For two given loci that could potentially interact, we model their randomly expected read counts using the cumulative binomial distribution, where the total number of trials is the number of reads that could possibly map between the loci (i.e. the region total), the rate of success is the expected interaction frequency, and the number of observed successes is the number of observed reads mapping between the loci. In this setting, regions with only 1 or 2 reads between them will have high p-values, regardless of their expected interaction frequency, while regions with many interactions above expected will have low p-values.
Parameters to Consider when Finding Significant
Interactions
Regions to Analyze
The analyzeHiC command will look for interactions across the entire genome unless otherwise specified. To specify a specific subset of the genome to analyze, use the "-chr/-start/-end/-pos/-p" options.
Super resolution and congruent interactions
When using a "-superRes <#>" value that is larger than the resolution ("-res <#>"), HOMER analyzes the Hi-C data in overlapping windows. If there is a truly significant interaction in the data, there is a good chance that multiple overlapping windows may observe the same reads and call the interaction multiple times with slightly different offsets. By default, HOMER looks through the identified interactions before writing them to the output and removes overlapping interactions (defined as overlapping at both endpoints), keeping only the interaction with the most significant logP value.
Limiting the Search Space
The further apart regions get, the less reads that are likely to map between them, and the less likely that a significant interaction is to be found. Depending on the resolution and the sequencing depth, it can be next to impossible to identify "significant interactions" past a certain distance. To control the space that is searched, specify "-maxDist <#>" or "-minDist <#>". This can dramatically speed up the search for high resolution interactions (i.e. "-res 10000 -maxDist 3000000").
Increasing Accuracy by Centering Interactions
If you add the option "-center", analyzeHiC will replace the coordinates of the regions in the output file by re-centering the regions on the average of the position of the Hi-C reads participating in the interaction. Lets say a region spans from position 10,000 to 20,000 (10k resolution), and it interacts with the region at 100,000 to 110,000. If most of the interacting regions originate from a regulatory elements at 17,000, the output file will be re-centered such that the output coordinates are 12,000 to 22,000 for the first region.
Interaction Reporting Filtering
By default, HOMER will report all interactions with a p-value less than 0.001. To modify this threshold, use "-pvalue <#>". You can also change the modified z-score cutoff using the parameter "-zscore <#>".
Multiple CPUs
Using the "-cpu <#>" option will speed up the analysis if analyzing multiple chromosomes.
Finding Differential Interactions between two Hi-C Experiments
To assess the interactions in a second Hi-C experiment, use the "-ped <HiC Tag Directory>" option. When this command is used with the "-interaction <outputfile.txt>" option, interactions are first found just like normal. After interactions are found, HOMER will go back and quantify the Hi-C reads for each interaction in the second Hi-C experiment. Independent statistics will be calculated for that experiment based on it's background model, and then it will be compared to the first Hi-C experiment. For example:
analyzeHiC ES-HiC/ -res 100000 -ped MEF-HiC/ -interactions significantInteractions.txt -nomatrixThe output file is slightly different in the case of a background Hi-C experiment. There are 8 extra columns as described below:
20**) Background Experiment Interaction ReadsNote that the background Hi-C experiment is not used to "find" interactions, just score the ones found in the primary Hi-C experiment. To find interactions that are specific to the background Hi-C experiment, reverse their positions in the command.
21) Background Experiment Expected Reads
22) Background Modified Z-score
23) Background LogP
24) Background total reads region 1
25) Background total reads region 2
26) LogP of Primary Experiment vs. Background
27) Modified Z-score of Primary Expeirment vs. Background
28) Circos Thickness (used for visualization by Circos)
(Column 20 is the Circos Thickness normally without specifying "-ped <tag dir>", see above)
Finding Intra-chromosomal Interactions Genome-wide at
High Resolution
A common task is to find all the interactions in the genome. With more sequencing and better data quality, the hope is to find interactions between individual regulatory elements, at a resolution of 10kb or less (maybe 1kb or 500bp! depending on restriction enzyme used). At these small resolutions it is near impossible to identify significant inter-chromosomal interactions, and the search space for inter-chromosomal interactions is massive.
To speed up the process, HOMER will look at chromosomes individually which allows it to save on resources. A separate program called findHiCInteractionsByChr.pl automates this process and helps speed up the calculation. Here's an example:
findHiCInteractionsByChr.pl ES-HiC/ -res 2000 -superRes 10000 -cpu 8 > outputInteractions.txtThe first argument MUST be the Hi-C tag directory. The output interaction formatted file is sent to stdout, so make sure to capture the output in a file. Other options are as follows:
-res <#> : resolution of analysis, see above, default: 2000
-superRes <#> : super resolution (window size), see above, default: 10000
-minDist <#> : Minimum distance between regions to consider for an interaction (default: -superRes value)
-maxDist <#> : Maximum distance between regions to consider for an interactions (default: 10,000,000) Changing this parameter may change the running time a bit
-pvalue <#> : pvalue cutoff, default: 0.01
-zscore <#> : modified z-score cutoff, default: 1.5
-cpu <#> : number of CPUs to use, default: 1 (remember that more CPUs will require more memory too)
-ped <background HiC directory> : Will quantify background experiment reads at significant interactions.
-std <#> : exclude regions with sequencing depth exceeding # std deviations, default: 4)
-min <#> : exclude regions with sequencing depth less than this fraction of mean, default: 0.2)
Miscellaneous Interaction Actions
Quantifying Hi-C reads Given Predetermined Interactions
Lets say you have known interactions, or interactions from another experiment. You can supply these as an input file to analyzeHiC and it will quantify their read counts and significance for you. The input file should look exactly like the HOMER formatted interaction file. It should be a tab-delimited text file. However, most of the columns can have a value of 0. The only values that MUST have values are the interaction IDs and region information (columns 1-12). The read totals to not need to be specified - HOMER will fill that in. To have HOMER analyze you given interactions, use the "-i <inputInteractions.txt>" option. Below is an example:
analyzeHiC ES-HiC -i inputInteractions -res 100000 -interactions outputInteractions.txt -nomatrixThe interaction quantification will be in the new outputInteractions.txt file from this example.
Retrieving Hi-C reads at Interacting Loci
To investigate the exact evidence that contributes to a given interaction or set of significant interactions, use the "-i <inputInteractions.txt>" option to specify your interactions of interest in conjunction with the "-iraw <outputFile.bed>" or "-irawtags <outputFile.tags.tsv>" options. These options will output the raw interactions from the Hi-C experiment that participate in the interaction in the input file. The "-iraw" output file is in BED format and can be uploaded to the UCSC Genome Browser to visualize your interactions.

Can't figure something out? Questions, comments, concerns, or other feedback:
cbenner@ucsd.edu