
HOMER
Software for motif discovery and next-gen sequencing analysis
SIMA: Structured Interaction Matrix Analysis
Hi-C is an unbiased assay of chromatin conformation,
resulting in even read coverage across the entire
genome. This, coupled with the fact that most Hi-C
reads describe interactions at close linear distance along
the chromosomes, results in relatively sparse read coverage
for interactions between individual restriction fragments
separated by great distance. This makes it difficult
to find high-resolution interactions across long
distances. To help identify which distal and/or
inter-chromosomal regions co-localize, we generally increase
the size of the regions [i.e. decrease the resolution] to
boost the number of Hi-C reads used for interaction
analysis. This is the most common and simplest
technique used by most approaches (including HOMER).
It's much easier to identify significant inter-chromosomal
interactions between regions that are 100kb in size than
regions that are only 5kb in size (essentially 20x more Hi-C
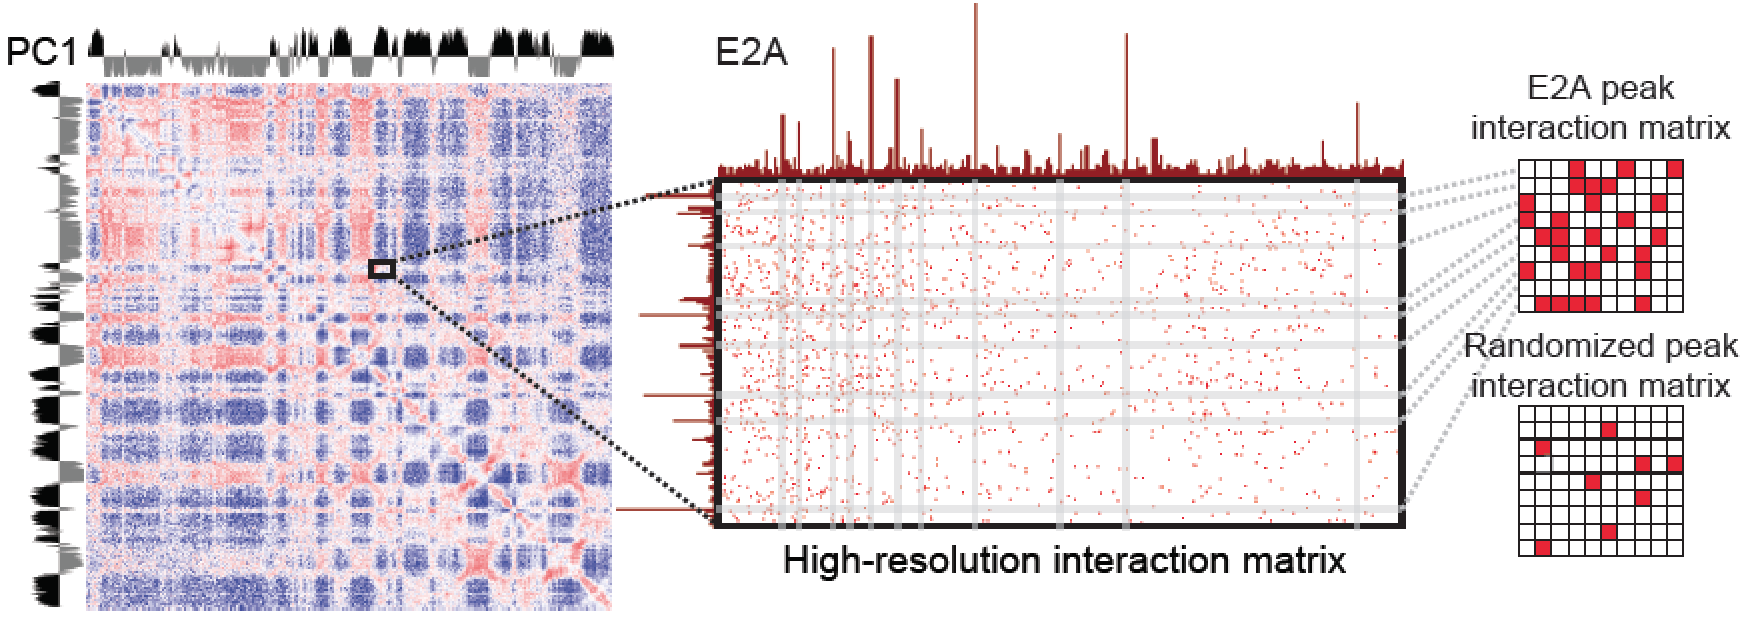
reads to work with).The major drawback to this methodology is that it is difficult to identify features that are responsible for mediating the interaction due to the large resolution size. To address this, HOMER implements an algorithm called Structured Interaction Matrix Analysis (or SIMA) to help identify which genomic features play a role in mediating interactions between two large domains. SIMA works by pooling interactions across a set of genomic features, such as ChIP-Seq peaks, and scores the relative enrichment of Hi-C interactions in these regions relative to randomly selected regions. The schematic below describes how this works:
SIMA takes a set of "domains" as input (could be only 1), and peak/BED files for assessing enrichment. SIMA then analyzes each domain against each of the other domains and calculates the number of interactions connecting peaks from on domain to peaks in the other domain (normalized for expected interactions based on the background model). It then randomizes the peak positions and recalculates the connecting interactions to generate a NULL distribution to use to gauge the significance of the interactions from the true peaks.
Generating Domains to use with SIMA
One common way to generate domains is to use compartment regions identified from PCA analysis. For example:
runHiCpca.pl esData ES-HiC/ -cpu 8You could also use topological domains, custom regions, etc. The input domain file for SIMA is a peak/BED file. If you only want to analyze a single region, just include a single region in the domain file.
findHiCCompartments.pl esData.PC1.txt > activeDomains.txt
Running SIMA
SIMA is generally run using a two step process. First, the calculations are made generating a table of results. Then this table can be used to generate visualization files. To run SIMA, use the SIMA.pl program as shown below:
SIMA.pl <Hi-C Tag Directory> -d <domain peak/BED file> -p <peak/BED file1> ... [other options] > outputTable.txt
For Example:
SIMA.pl Bcell-HiC/ -d domains.txt -p pu1.peaks.txt -cpu 8 -chr chr19 > simaOutput.txt
By default, this will compare each domain to every other domain. For set of domain comparisons, the peak files supplied will be used to assess their significance as interaction anchors between domains.
SIMA.pl can take a while to run since it's performing high resolution analysis across the interaction space. If you have multiple CPUs, it's highly recommended to run SIMA.pl with the "-cpu <#>" option.
Below are important options to help control how SIMA is run:
-d <domain peak/BED file> : regions to use as domainsSIMA will send the output table to stdout. Below is a description of the output columns:
-minDsize <#> : removes domains smaller than this size (default: 500000)-p <peak/BED file> [peak/BED file2] ... : regions to score interactions at. You can supply multiple peak files. Each peak file will be used separately to score interactions (file1 vs file1, file2 vs file2, etc.)
-AvsA : compare each of the peaks against one another.-res <#> | -superRes <#> : Sets resolution of analysis (default: -res 2000 -superRes 10000)
-p2 <peak/BED file> [peak/BED file2] ... : Peaks must be "paired" with peaks specified with "-p <peak/BED> ...". This allows different types of peaks to be compared (file1[-p] vs. file1[-p2], file2[-p] vs. file2[-p2], etc.). If in doubt, use the "-AvsA" option.
-minDist <#> : Do not consider Hi-C interactions spanning less than this distance. Important for keeping analysis away from the diagonal of interaction matrix (default: 2x super resolution).
-min <#> : minimum distance between domains to analyze (default: -1).
-max <#> : maximum distance between domains to analyze (default: 1e9). To only analyze domains vs. themselves, set this value to something very low. To analyze all possible domains (including interchromosomeal interactions), set to -1.
-chr <chr> : only analyze domains found on this chromsome
-N <#> : Number of randomization for calculating significance scores.
-cpu < #> : Number of CPUs to use (Domain comparisons will be done on separate CPUs)
- region name for domain1
- chr for domain1
- start position for domain1
- end position for domain1
- region name for domain2
- chr for domain2
- start position for domain2
- end position for domain2
- peak/BED file1 (for domain1)
- peak/BED file2 (for domain2
- Number of peaks in domain1
- Number of peaks in domain2
- p-value of comparison
- Ratio of observed Hi-C Read enrichment vs. Randomized Average (e.g. col 15 vs. col 16)
- Peak enrichment ratio vs. expected interactions
- Average randomized peak enrichment ratio vs. expected interactions
Interpreting SIMA results
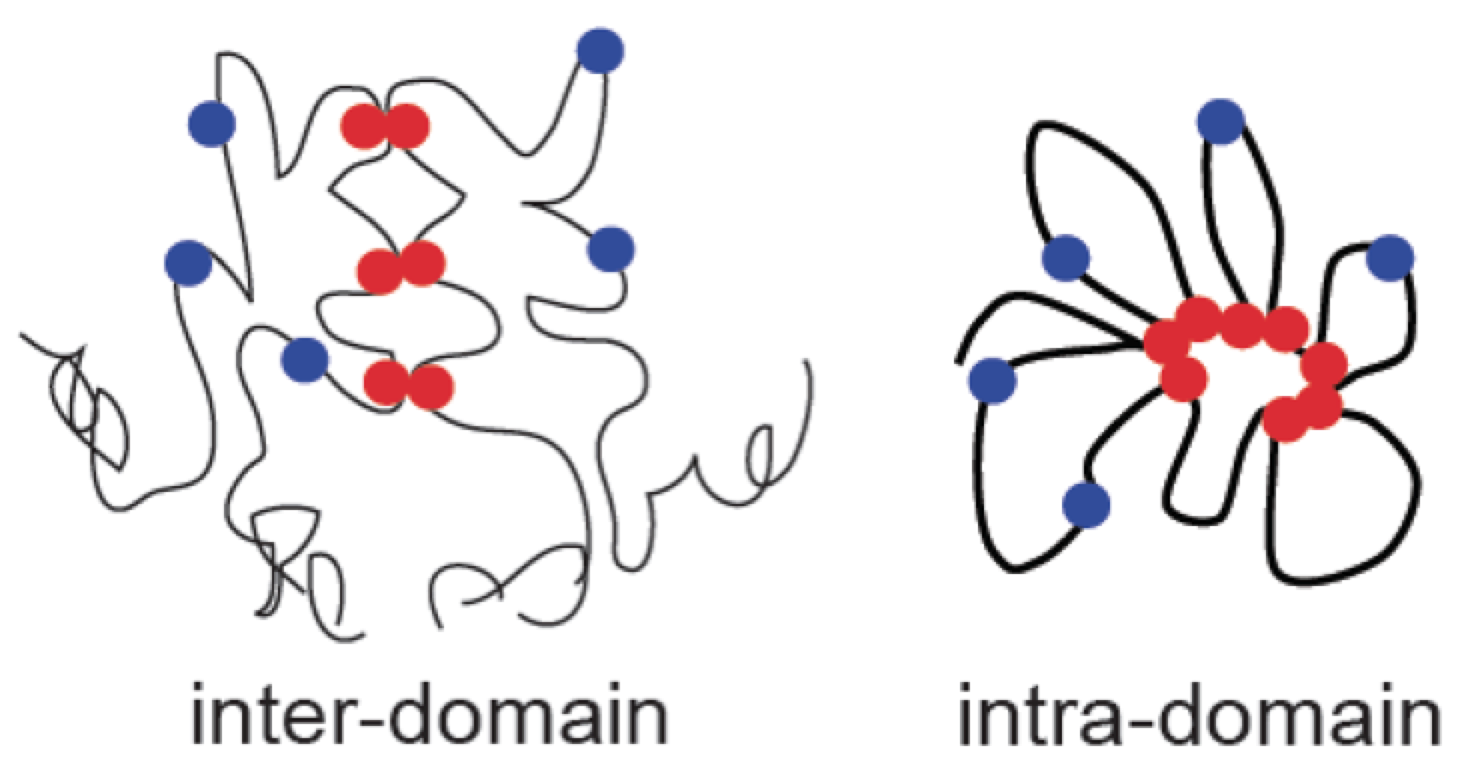
When comparing one domain versus another, a strong positive ratio [col 14] (and low p-value) implies that the peaks used in the analysis participate in a higher proportion of the inter-domain interactions then expected by chance (red below). If inter-domain interactions are depleted at the peak positions, the ratio will be well below 1.
When comparing a domain versus itself, a strong positive ratio implies that the peaks participate in a high proportion of the intra-domain interactions. Below is a schematic to illustrate the physical interpretation.
Visualizing SIMA Results
After running SIMA to generate the output table, you can run SIMA.pl again to generate visualization files. Generating visualization files is quick - the idea is to run the analysis once (which takes much longer), and then you can experiment with different visualization options.
Generally, there are two ways to visualize SIMA results. To visualize how SIMA scores vary across domains, the Matrix/Heapmap option can be used. To visualize how multiple peaks form interactions across a single domain (or set of domains), then the Cytoscape option should be used.
Domain Comparison Matrix/Heatmap
SIMA will visualize the domain interaction scores using the following command:
SIMA.pl -matrix <SIMA output from analysis> [options] > outputMatrix.txtIn practice, you would run SIMA like this (using PC1 compartments saved in the file "domains"):
#run SIMA first
SIMA.pl Bcell-HiC -d domains.txt -p ctcf.peaks.txt -cpu 8 -chr chr11 > simaOutputTable.txt
#create heatmap
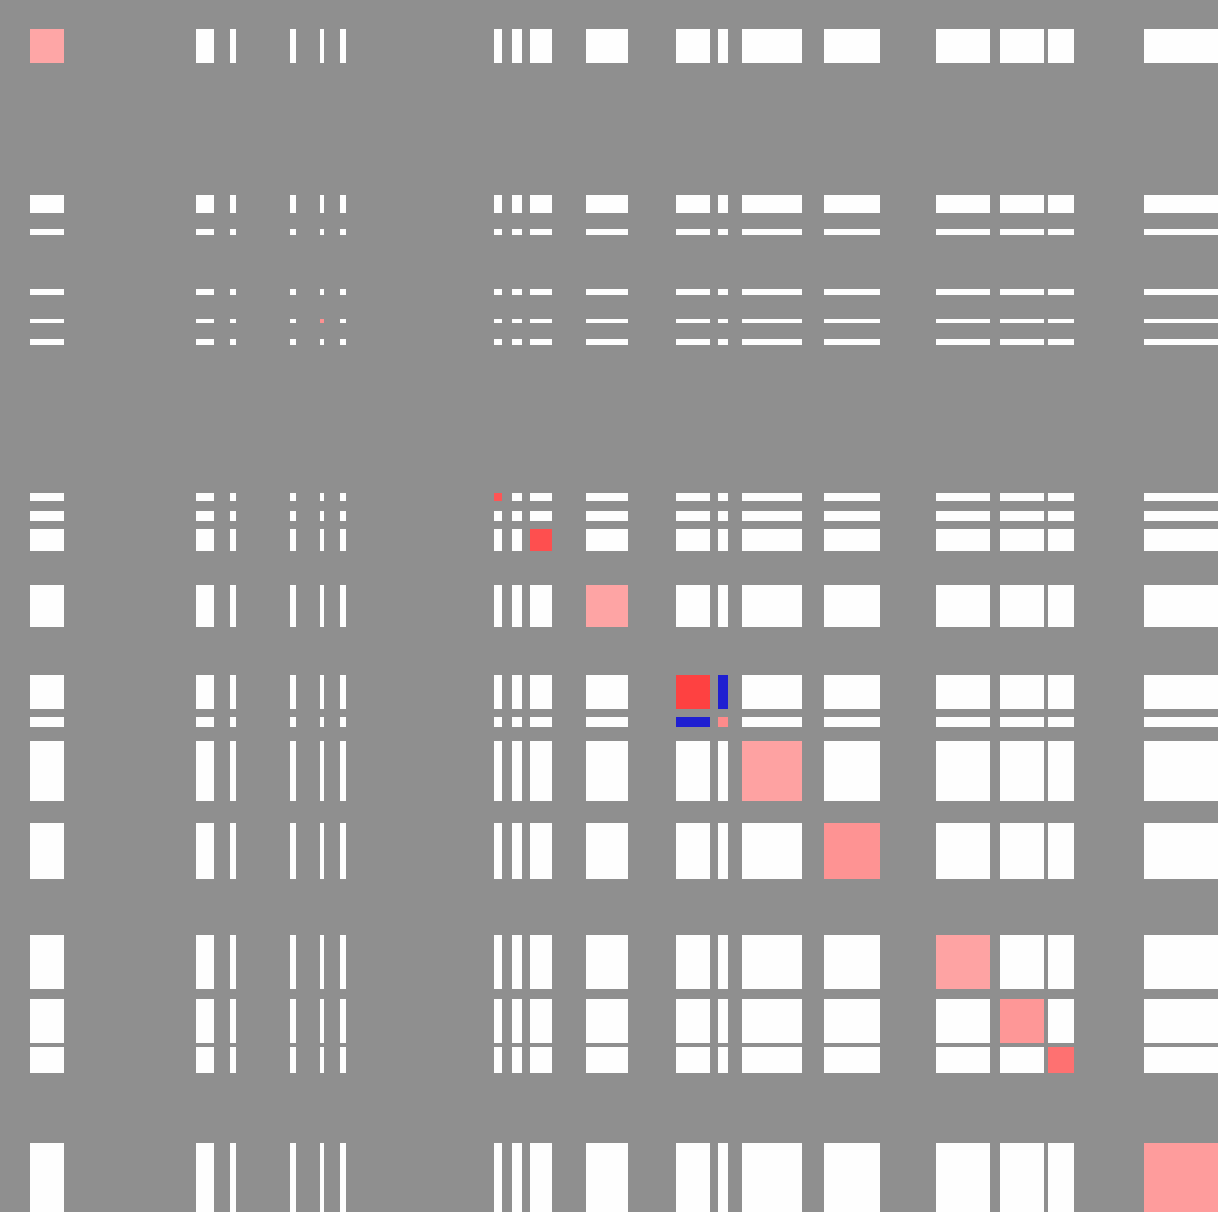
SIMA.pl -matrix simaOutputTable.txt -p ctcf.peaks.txt -minPeaks 5 > outputMatrix.txt
Viewing the "outputMatrix.txt" with Java Tree View (visualizing values as log2):
Each row and column is an active compartment along chr11 (these regions correspond to the PC1 values in the SIMA figure at the beginning of this section)
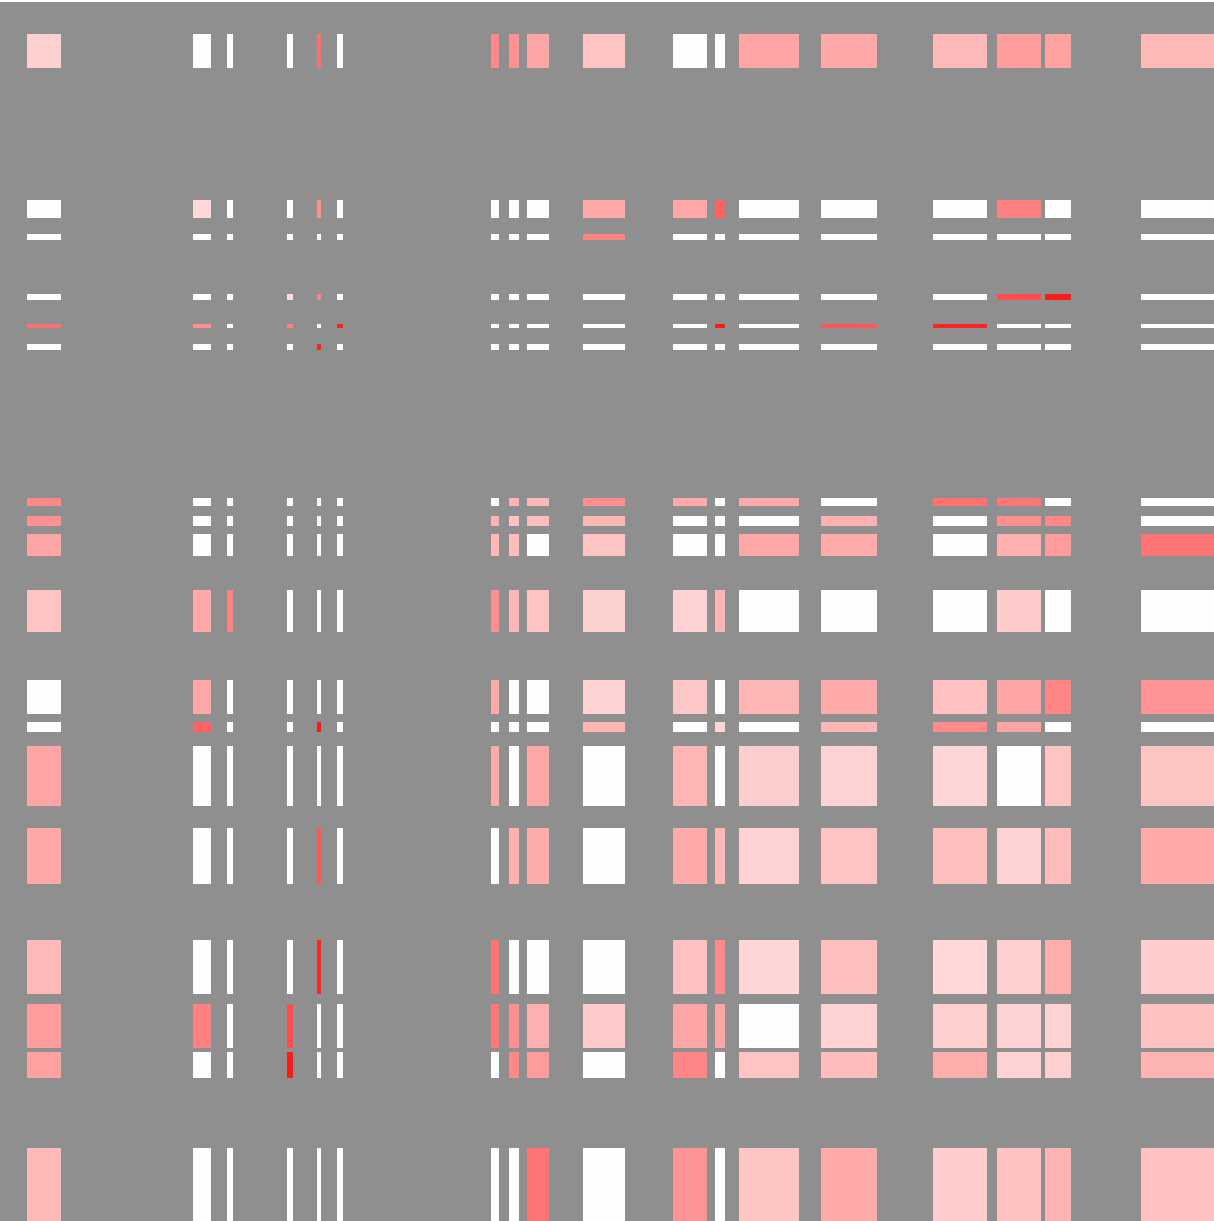
If we use TSS for the SIMA analysis instead of CTCF peaks, we get something that looks more like this:
There are several option to tune how the result is shown:
-res <#> : Resolution of output matrix file (default: 200000). You'll need to adjust this if your domain sizes are small.
-p <peak/BED file> : display results for this peak file (if multiple peaks were analyzed at once)
-minPeaks <#> : only display regions with at least this many peaks.
-stat <pvalue|ratio> : display this value in the heatmap (default: ratio)
-pvalue <#> : only display ratio of domain relationships if the p-value is less than this value (default: 0.01)
Relationship between peaks in Cytoscape
To understand the relationship between peak files and Hi-C interactions across a single domain/region, SIMA has an option to output files that can be visualized using Cytoscape. Normally to run SIMA in this mode, you would collect several peak files and use the "-AvsA" option in the command like this:
# save a single region into the file domain.txtTo generate the visualization files, run SIMA.pl with the "-cytoscape" option:
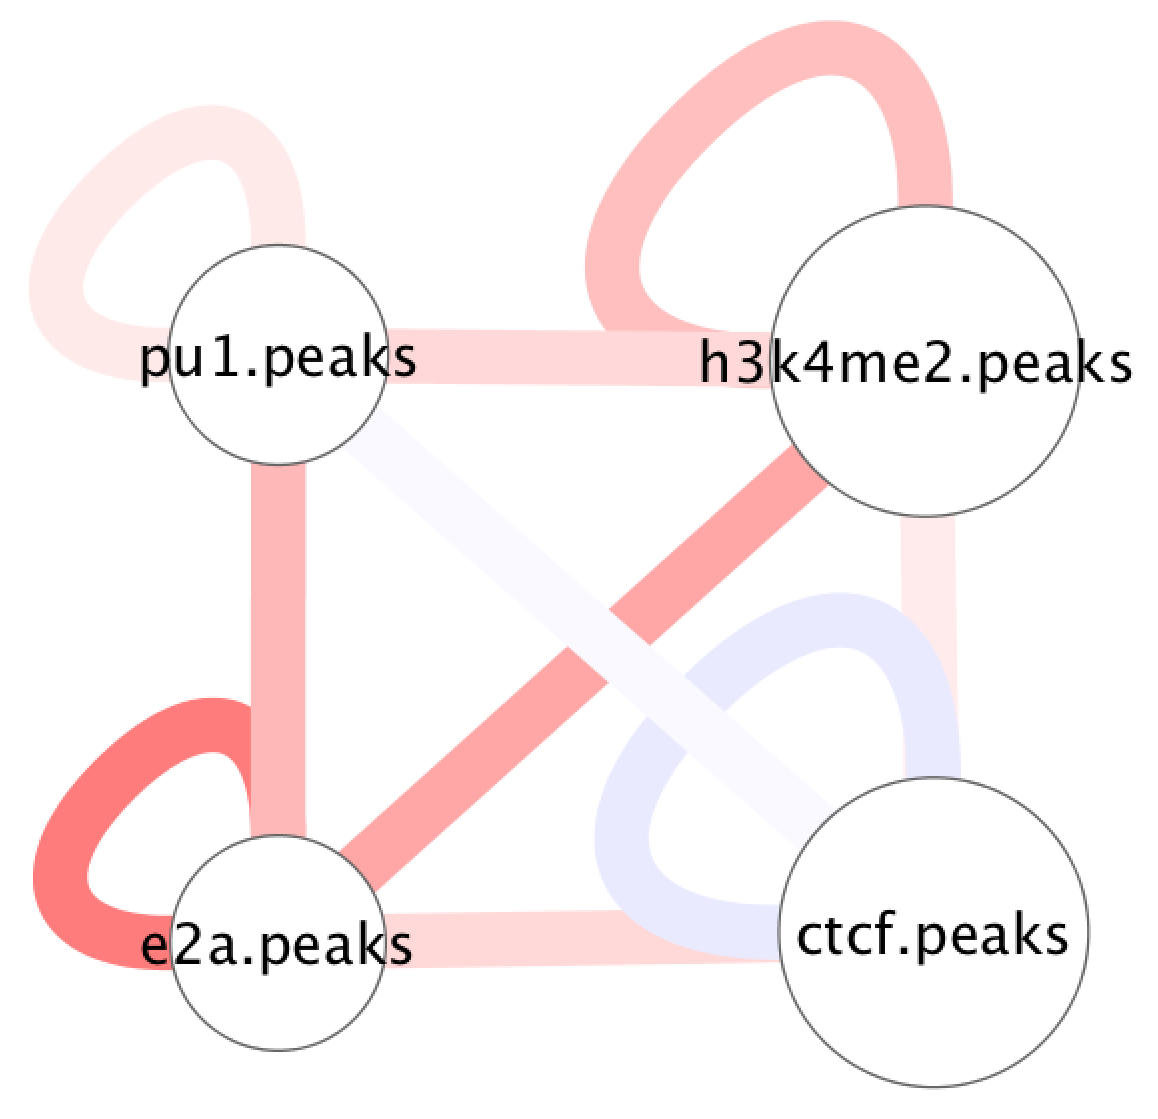
SIMA.pl Bcell-HiC -p ctcf.peaks pu1.peaks h3k4me2.peaks e2a.peaks -d domain.txt -AvsA > outputTable.txt
SIMA.pl -cytoscape <SIMA output from analysis> [options]Running SIMA.pl with the "-cytoscape" option will produce several output files:
For example:
SIMA.pl -cytoscape outputTable.txt
cytoscape.InputFilename.network.txtThese files can be loaded into Cytoscape in a similar manner to that described for global interactions (see here). For example, visualizing the example above should look something like this:
cytoscape.InputFilename.nodes.size.txt
cytoscape.InputFilename.edges.ratio.txt
cytoscape.InputFilename.edges.pvalue.txt
If SIMA was original run with multiple domains, you can create cytoscape files specific to the domains of interest by using the "-dname <domain name1>" and "-dname2 <domain name2>" options.
Command Line options for SIMA.pl
Normal usage: SIMA.pl <HIC directory> [options]Output table is sent to stdout
(See below for output visualization formatting)
Required Options:
-d <domain peak file> (Domains to perform analysis on)
-p <peak file1> [peak file2] ... (features to check for enrichment)
Options:
-res <#> (resolution, default=2500)
-superRes <#> (super resolution/window size, default=10000)
-minDist <#> (minimum interaction read distance, default: 2x superRes)
-minDsize <#> (minimum domain size, default: 500000)
-min <#> (minimum distance between domains to test significance, default=-1)
-max <#> (maximum distance, set to -1 to allow inter-chr, default=1e9)
-chr <chromosome> (only analyze this chromosome, default: all)
-p2 <peak file1> [peak file2] ... (heterogenous peak enrichments)
-AvsA (All versus All, compare -p peaks against one another)
-N <#> (Number of randomizations per domain, default: 1000)
-cpu <#> (number of CPUs to use for analysis, default: 1)
Output Visualization Formatting (Run SIMA first, then format the output)
Matrix Mode: Takes output and prints out a matrix for visualization
SIMA.pl -matrix <SIMA output from analysis> [options]
Matrix Mode Options: (defaults to resolution of 200000, output to stdout)
-stat <pvalue|ratio> (output stat for matrix mode, default: ratio)
-pvalue <#> (p-value cutoff to report the ratio, default: 0.01)
-minPeaks <#> (minimum number of peaks, default: none)
-res <#> (resolution of matrix, default=200000)
-p <peak file1> (features from initial analysis to show)
-p2 <peak file2> (features from initial analysis to show, if used/different)
Cytoscape Mode: Takes output from single domain and prints files
SIMA.pl -cytoscape <SIMA output from analysis>
(output to "cytoscape.filename.*" files)
-dname <name> (domain name to show)
-dname2 <name2> (domain name to show, if different)

Can't figure something out? Questions, comments, concerns, or other feedback:
cbenner@ucsd.edu