
HOMER
Software for motif discovery and next-gen sequencing analysis
Visualizing Hi-C Interactions with HOMER and Circos
Circos is a great program
for visualizing interactions and integrating other data
sources. To streamline the process of creating circos
diagrams from Hi-C data and combining it with other types of
sequencing, HOMER integrates several routines for preparing
Circos input files. These configuration/data files are
part of the output, allowing the user to modify/tweak them
to produce the perfect image in Circos. To get perfect
looking pictures, you have to learn a thing or two about
Circos, but HOMER will do it's best to give you a quality
image without needing to become an expert with Circos.Required if not done already: Install Circos.
Finding Significant Hi-C Interactions with HOMER
Circos is simply a visualization tool (It does not analyze your data). To use it with HOMER, you must first understand how HOMER defines significant interactions, and should have a general idea how the analyzeHiC program works (see here and here), otherwise some of what follows may not make much sense. You can also feed HOMER interactions to visualize that may have nothing to do with Hi-C (use the "-i <interactionFile>" option with a HOMER interaction formatted file).
Generating Circos Diagrams with HOMER
To generate a Circos diagram, add "-circos <prefix>" to you analyzeHiC command. For example:
analyzeHiC <HiC Tag Directory> -res <#> -pos chrN:X-Y -circos <prefix> -nomatrix
i.e. analyzeHiC ES-HiC -res 50000 -pos chr1:20,000,000-50,000,000 -circos chr1Interactions -nomatrix
The "-nomatrix" option is optional, but normally you don't care about the normal matrix produced by analyzeHiC. This command will produce several files. In this case, the <prefix> was "chr1Interactions", so all files will start with that:
chr1Interactions.circos.confThe final two of which are the actual output images. The PNG is nice for normal viewing, the SVG is better for importing into graphics applications like Illustrator.
chr1Interactions.circos.interactions.txt
chr1Interactions.circos.karyotype.txt
chr1Interactions.circos.png
chr1Interactions.circos.svg
(more files may be present with additional options...)
Often, the circos diagram is not perfect - you may want to change the font, or the color. To do this, edit the "prefix.circos.conf" file with the appropriate settings, and then rerun the circos image generation using:
circos -conf prefix.circos.confThis will produce new PNG and SVG files. Circos is all about creating your *.circos.conf file - the program has very few command line options that are regularly used. Circos is also a very feature rich program that could take you years to fully explore. To learn more about how to edit circos.conf files, check out the Circos tutorials.
i.e. circos -conf chr1Interactions.circos.conf
Important Interaction Parameters
Often your interactions may not look that great. Could be you need to adjust these parameters to clean up the image:
-pvalue <#> : Will filter out interactions with a pvalue greater thatn # (default, 0.001). You may need to try different values to clean up the image
-res <#> / -superRes <#> : controls the resolution of the analysis
-minDist <#> : Useful to set this to exclude trivial interaction between adjacent regions, etc.
Adding Sequencing Data to Circos Output
analyzeHiC has three general options for automating the visualization different types of data:
-d <tag directory1> [tag directory2] ...Circos is a very powerful program, and there are lots of other types of things you can do with your data as well. These are only the ones covered by HOMER, but don't let that limit you if you want to use other types of data.
Add ChIP-Seq, RNA-Seq, or really any data from a HOMER tag directory. makeUCSCfile will be called to generate a bedGraph-b <peak/BED file1> [peak/BED file2] ...
Add peak/BED files to identify were certain features are located-g <named peak/BED file>
Similar to the "-b" option, but in this case the regions will be named. This is most useful for annotating gene positions in the file. Gene files you may want to use (you can also easily make your own) [duplicates removed, longest versions of genes kept]:
RefSeq genes for mm9: mm9.genes.txt
RefSeq genes for hg18: hg18.genes.txt
RefSeq genes for hg19: hg19.genes.txt
Below is a demonstration of how you can add additional data to your circos output. First, we will visualize the B cell interactions formed in along a region of chr11:
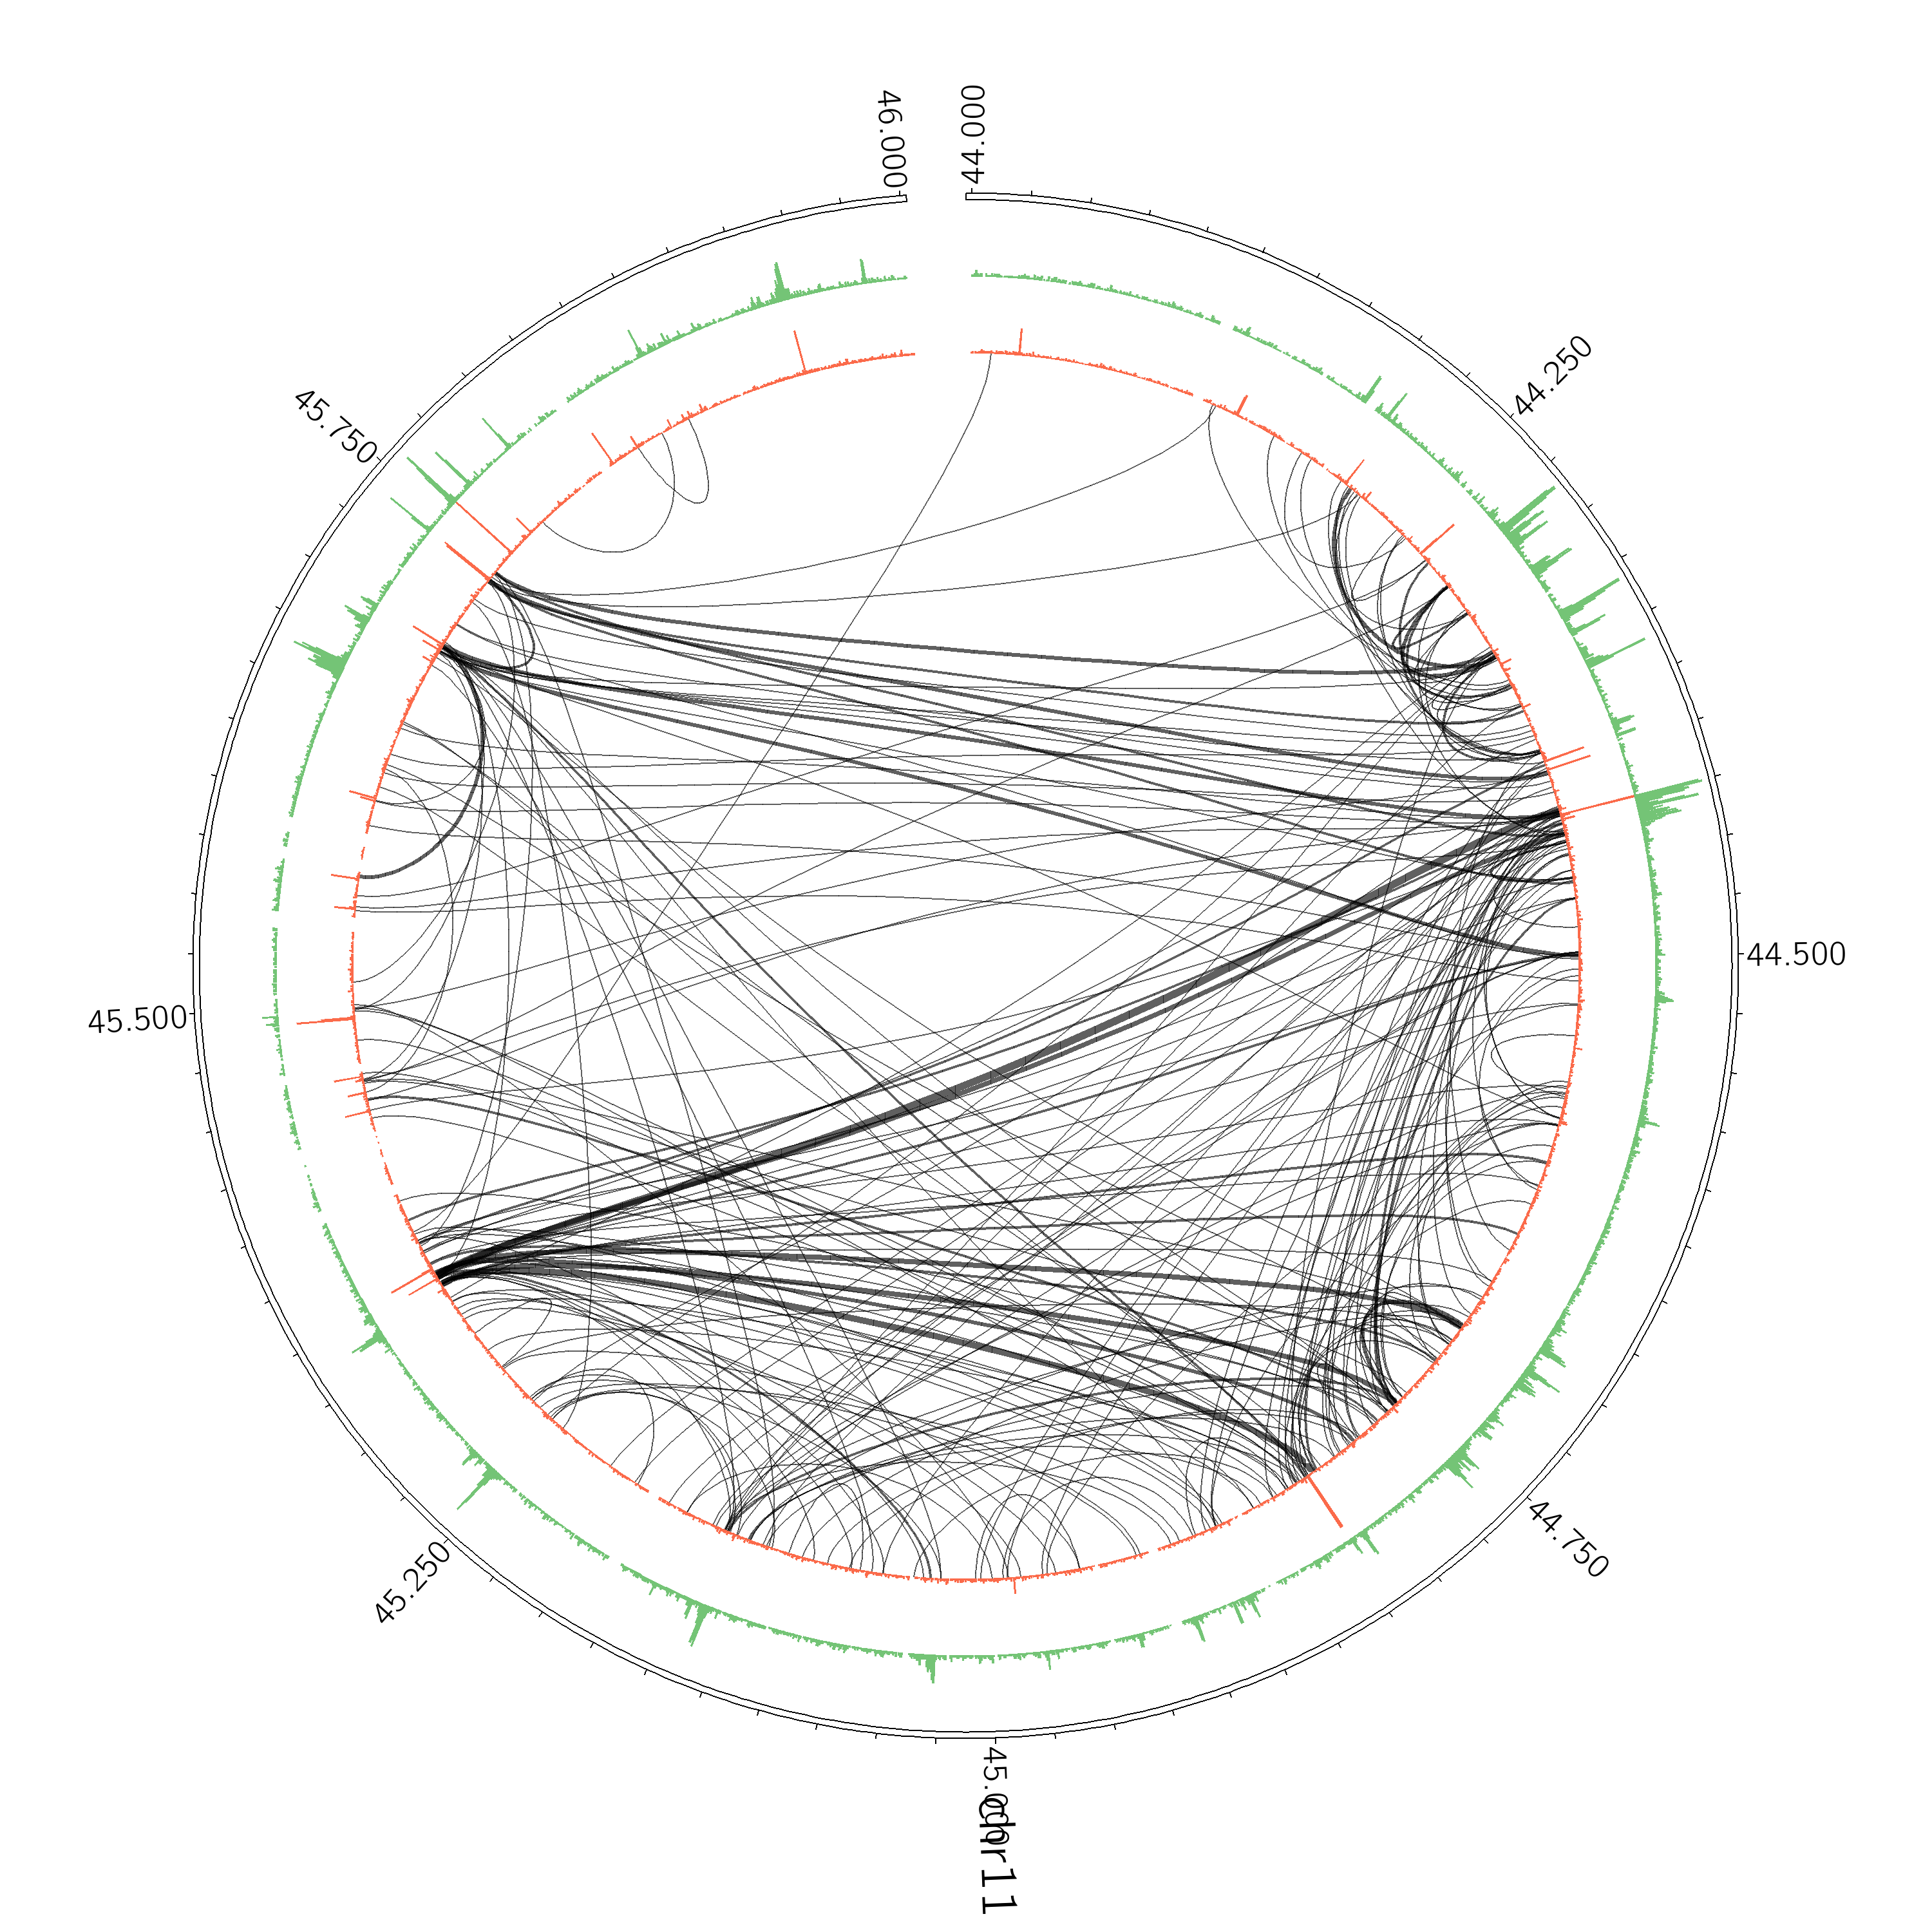
analyzeHiC proB-HiC -pos chr11:44,000,000-46,000,000 -res 2500 -superRes 10000 -circos cirOutput -nomatrix -minDist 20000Next, lets add some ChIP-Seq data for CTCF (inslutor/boundary transcription factor) and H3K4me2 (epigenetic histone modification found at promoters and enhancers):
analyzeHiC proB-HiC -pos chr11:44,000,000-46,000,000 -res 2500 -superRes 10000 -circos cirOutput -nomatrix -minDist 20000 -d CTCF-chipseq/ H3K4me2-chipseq/
In this case the interactions didn't change, but the layout was adjusted to make room for ChIP-Seq data.
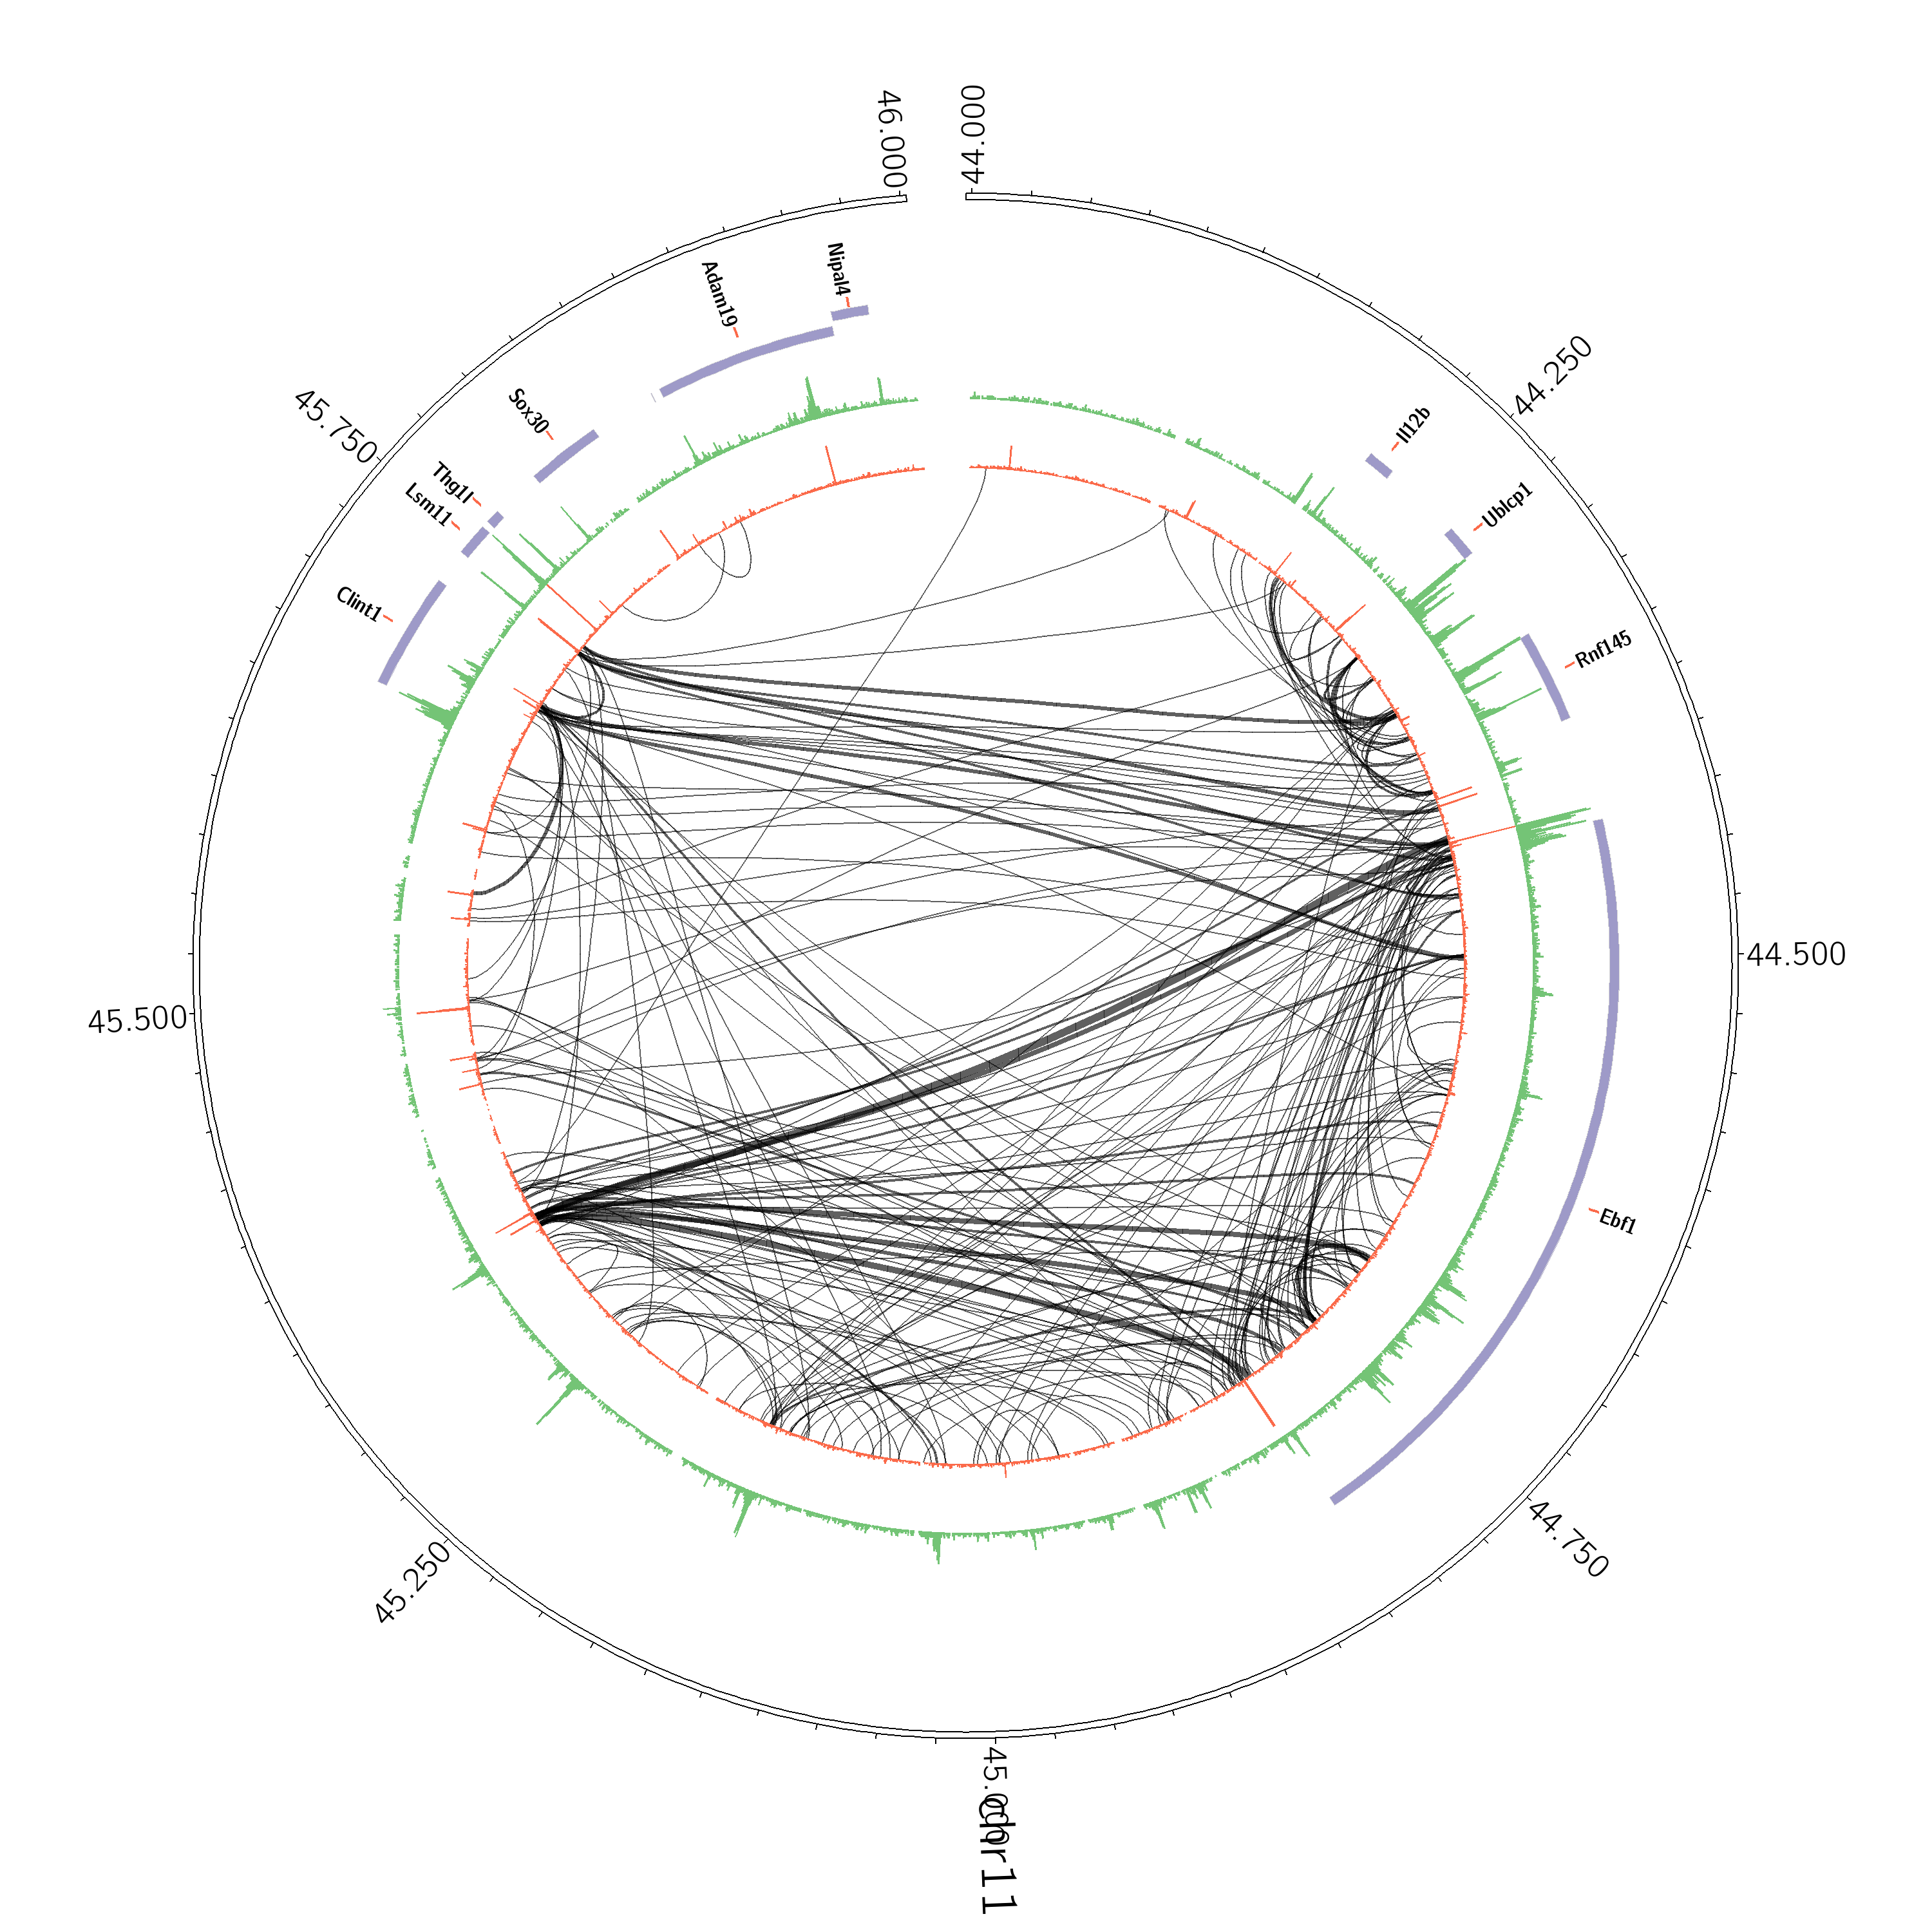
Now lets show where the genes are - do with by adding the "-g" option.
analyzeHiC proB-HiC -pos chr11:44,000,000-46,000,000 -res 2500 -superRes 10000 -circos cirOutput -nomatrix -minDist 20000 -d CTCF-chipseq/ H3K4me2-chipseq/ -g mm9.genes.txt
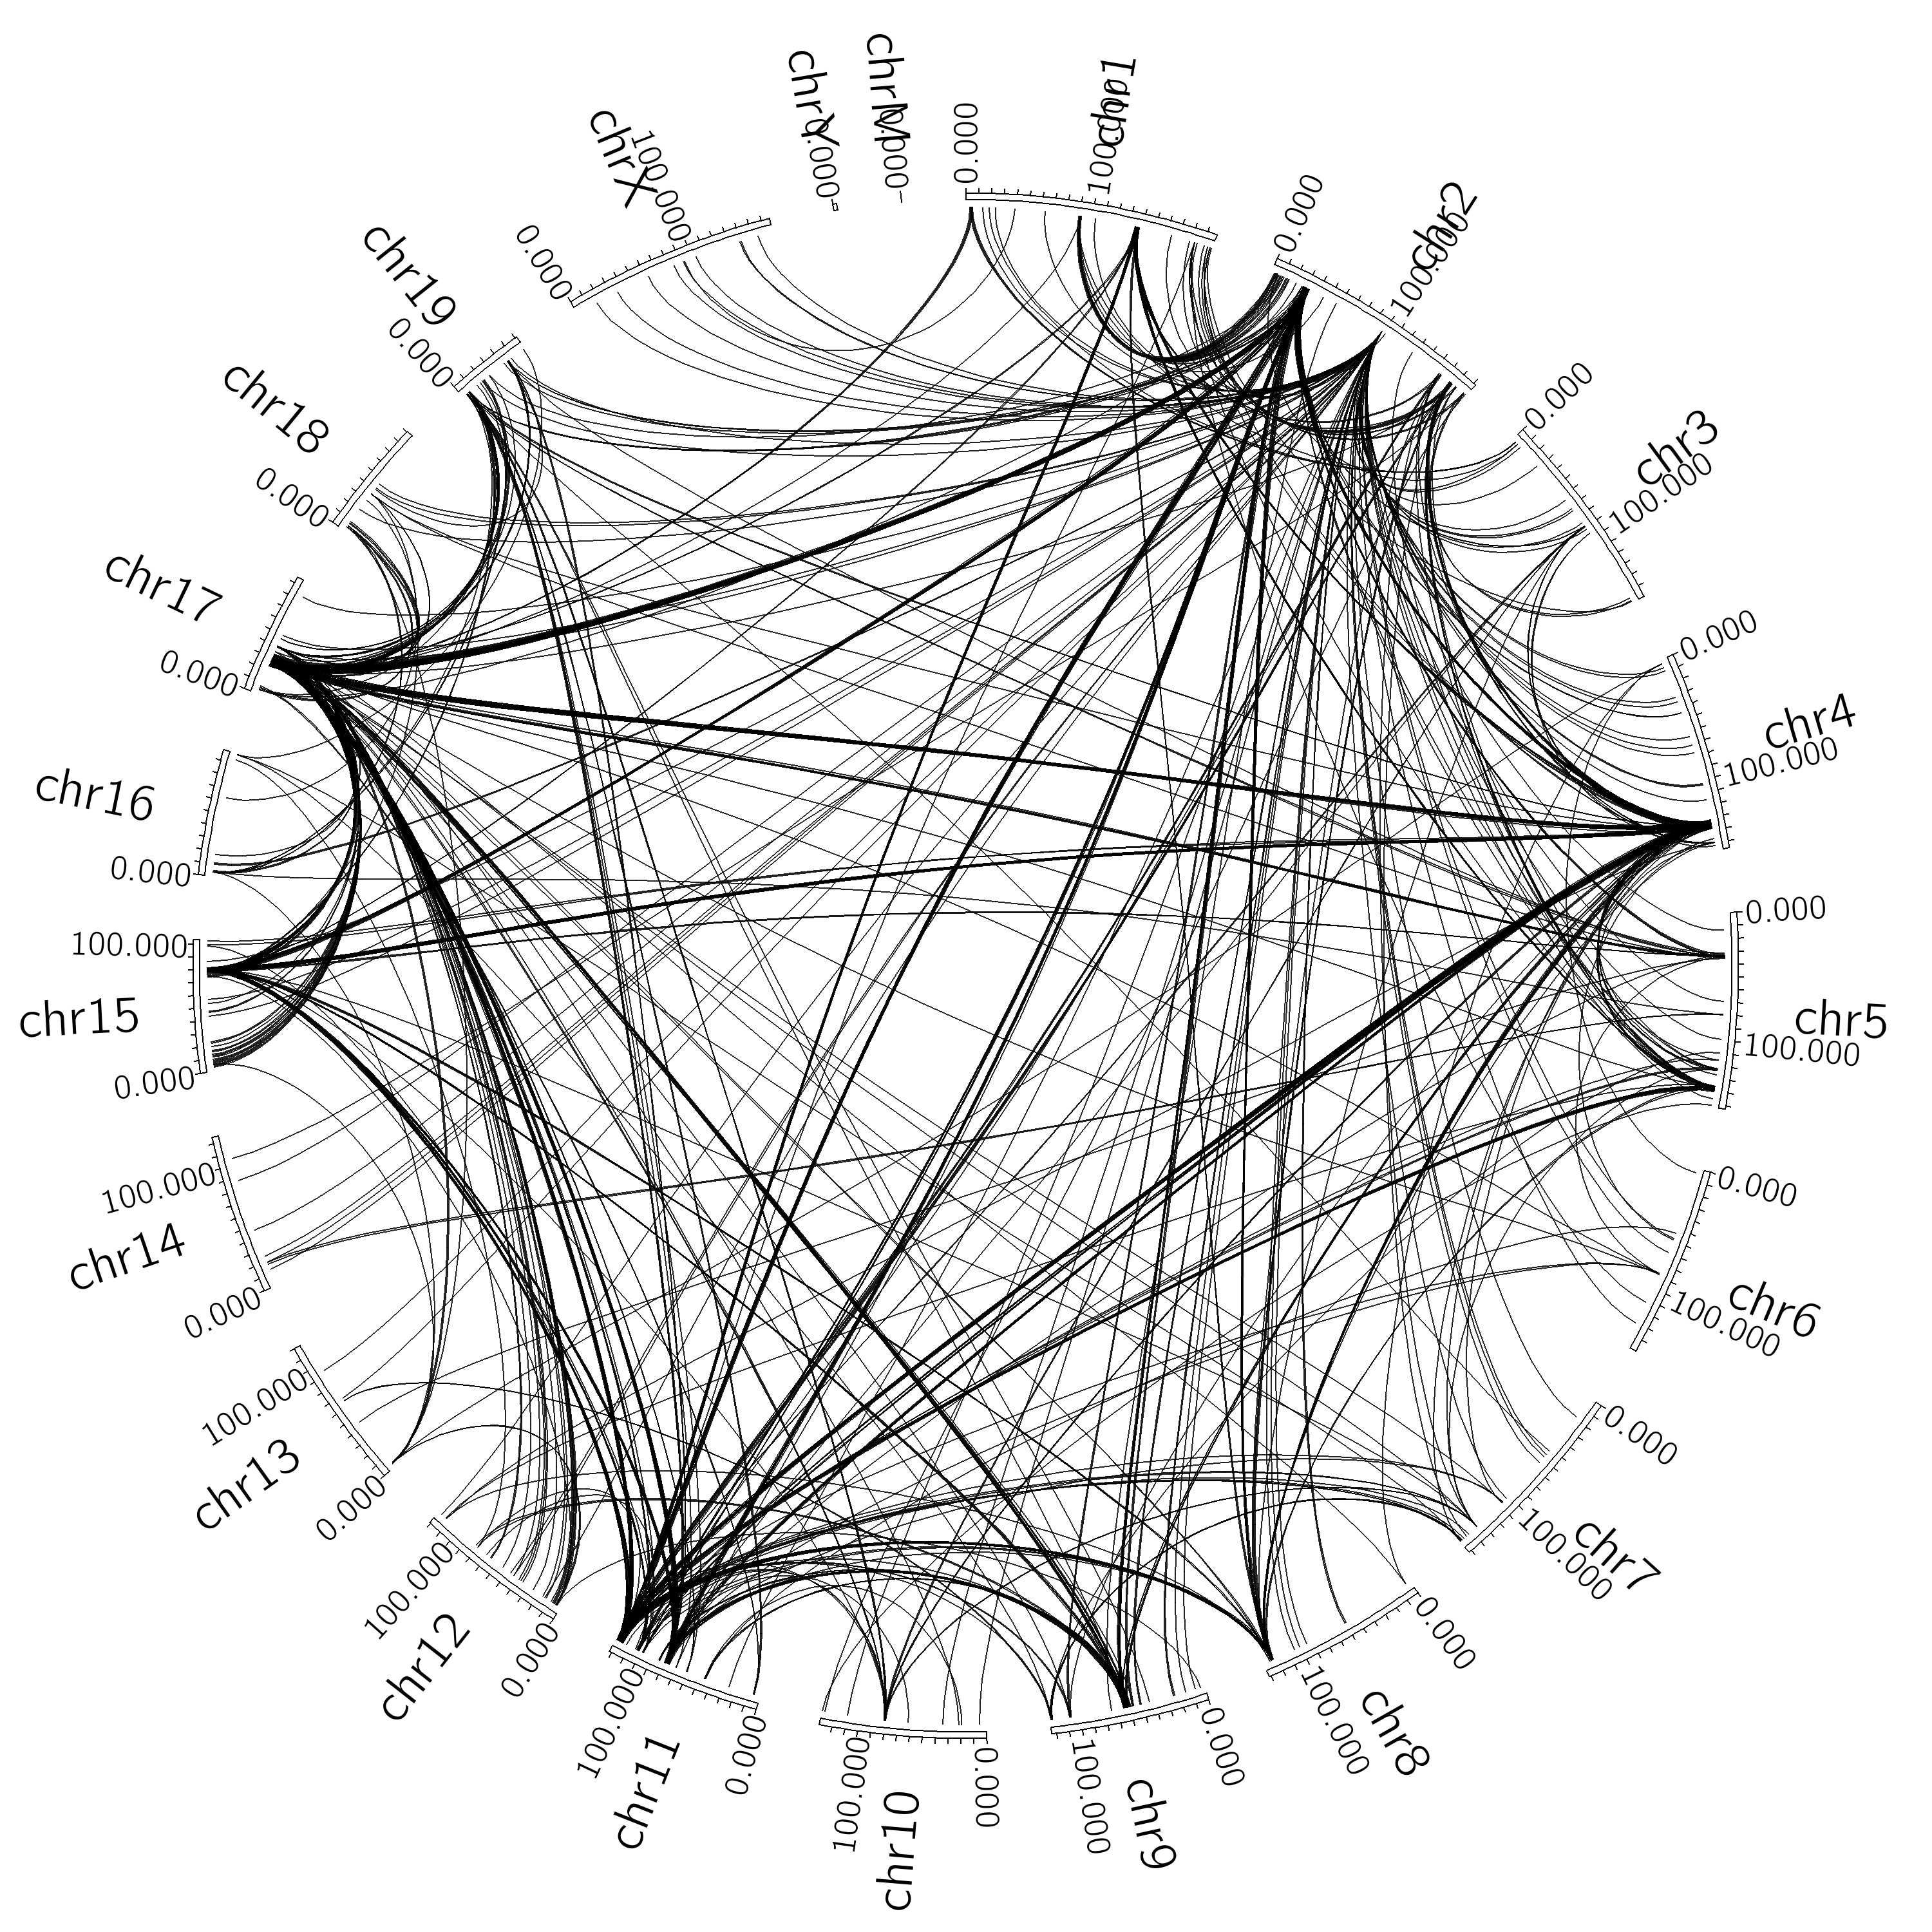
In the end, there are lots of ways to generate circos figures. For example, lets say you want to visualize interchromosomal interactions? Consider the following (the -minDist was set very high such that intrachromosomal interactions will be ignored):
analyzeHiC proB-HiC -res 1000000 -cpu 8 -pvalue 1e-7 -circos interChrom -minDist 2000000000 -nomatrix
Modifying Circos output without rerunning analyzeHiC
Often you'll run analyzeHiC with the "-circos <prefix>" option and get a giant mess of interactions, especially if the "-threshold <#>" is set low. Sometimes things are not clear, or the ChIP-Seq signal is too low low to see. For these types of problems, it is necessary to directly modify the input files for Circos instead of rerunning analyzeHiC with different parameters. Below is a set of modifications that may be helpful. There are a ton of other things you can do with Circos, so it might be worth learning more about it from the source.
To regenerate the Circos output after making modifications, simply run:
circos -conf <prefix>.circos.conf
If you ran: analyzeHiC ES-HiC -res 50000 -chr chr1 -circos chr1Interactions > output.txt
Then run: circos -conf chr1Interactions.circos.conf
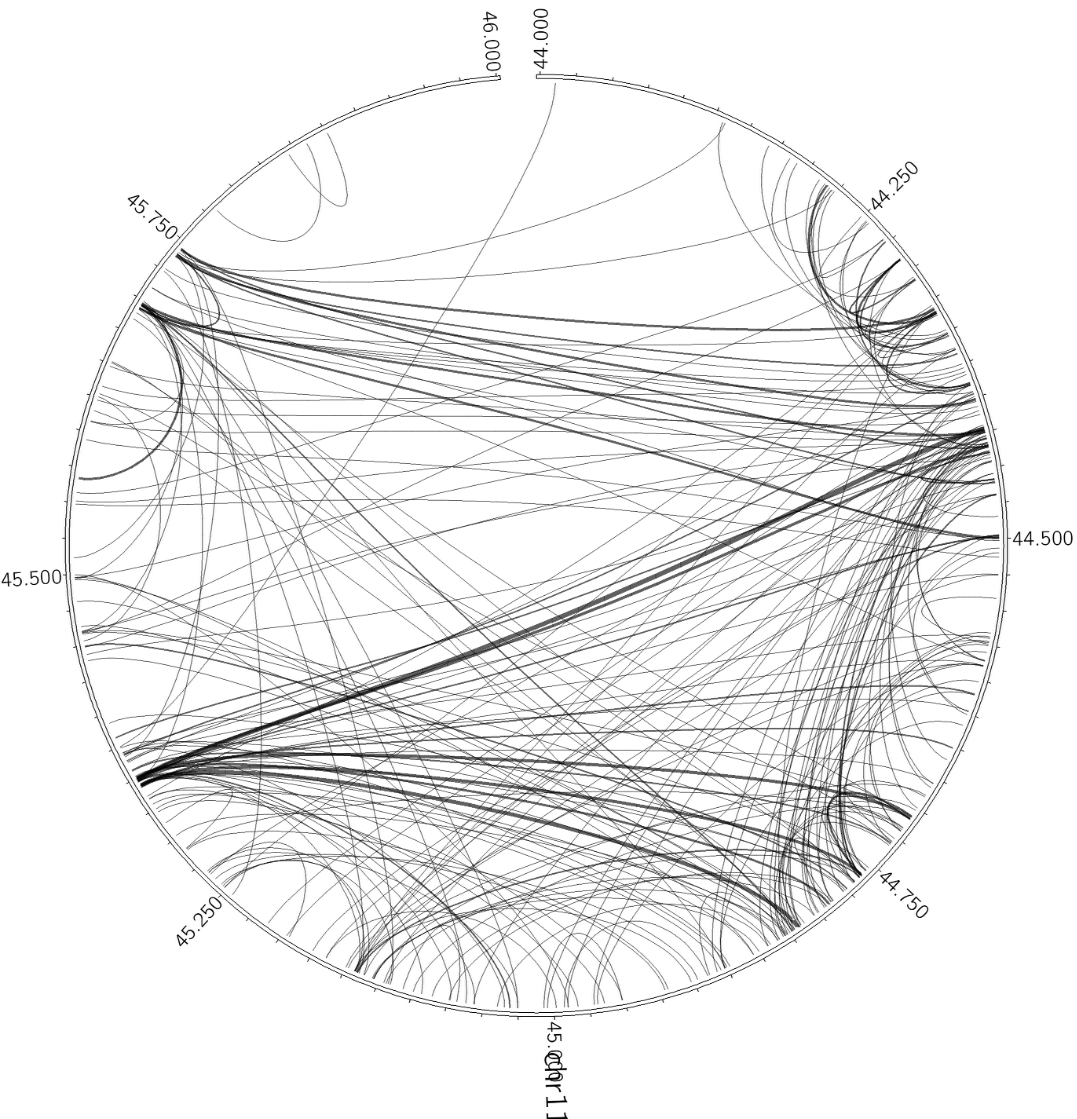
Visualizing Subsets of Interactions
Lets say you want to see only interactions that are interchromosomal, or only the interactions that are greater than 50Mb apart. You can control this by adding "Rules" to the Circos configuration file. If you open the <prefix>.circos.conf file in a text editor, you should see something like this:
...The idea is to add additional rules to the file such as:
<rules>
<rule>
importance = 200
condition = _THICKNESS1_ > 20
thickness = 20
</rule>
...
...
<rules>
<rule>
importance = 200
condition = _THICKNESS1_ > 20
thickness = 20
</rule>
<rule>
importance = 250
condition = _INTRACHR_ && abs(_POSITION1_ - _POSITION2_) < 50Mb
show = no
</rule>
...
This rule with check the condition - is the interaction intra chromosomal and are the interacting positions less then 50Mb - then Circos will modify the way the interaction is shown. In this case, it says "show = no", which will hide the interaction. Make sure the "importance" is higher than the other importance numbers - this specifies which rules take priority - 250 is fine. Lets say we only want to show only interchromosomal interactions. We'd add the rule:
<rule>
importance = 250
condition = _INTRACHR_
show = no
</rule>
I this case, if the interaction is intrachromosomal, then it won't show it. If you'd prefer to color those interactions a different color instead of hiding them, try "color = red" instead of "show = no".
For more on rules, check out the Circos tutorial.
Changing the Range on tag directory (i.e. ChIP-Seq) tag pileups
By default, analyzeHiC will display tag densities ranging from 0 to 100 normalized tag counts. For some data this is the wrong range. To change this manually, edit the <prefix>.circos.conf file and change the min and max parameters (you can also change the color and other things):
...<plots>
<plot>
show = yes
z=5
type = histogram
r0 = 0.90r
r1 = 1.00r
color = red
fill_color = red
fill_under = yes
thickness = 1
extend_bin = no
background = no
axis = no
file = yyy.circos.histogram1.txt
min = 0
max = 100
</plot>
...
</plots>
...
More info from Circos

Can't figure something out? Questions, comments, concerns, or other feedback:
cbenner@ucsd.edu