
HOMER
Software for motif discovery and next-gen sequencing analysis
Annotating and Analyzing Significant Interactions From
Hi-C Data
Once you have found significant interactions in your data,
it's time to figure out what it means. HOMER contains
a tool called annotateInteractions.pl that can be
used to execute a variety of different types of analysis
(analogous to annotatePeaks.pl in some ways). The annotateInteractions.pl command takes a HOMER-style interaction file as input (see here). The interactions do not need to be produced by HOMER - they can come from any tool or created manually, but they must have the same format. The basic syntax of the command is as follows:
annotateInteractions.pl <interaction file> <genome version> <output directory> [additional options...]By default, this command will produce a bunch of output files and place them in the given output directory. Below is a description of the default output files. Additional options enable the assessment of feature enrichment, and are covered further down.
example: annotateInteractions.pl bcell-Interactions.txt mm9 AnnotationOutputDirectory/
Many of the options for the annotateInteractions.pl command are used to filter the interactions such that a subset is analyzed or annotated. Filtering options are described below. One of the main purposes for the filtering options is so that liberal cutoffs for the p-value and z-score can be selected when running the analyzeHiC or findHiCInteractionsByChr.pl command to find the initial set of interactions. Once this large list of possible interactions is found, the p-value and z-score cutoffs can be changed/optimized in the annotateInteractions.pl command to avoid rerunning the other commands, which can be very time consuming.
Default Annotation Output:
Each of these output files will be placed in the chosen output directory
interactions.txt
This file is a "HOMER interaction" formatted file that contains the interactions used in the analysis. Several of the annotateInteractions.pl options are used to filter the input interactions, and this file will only contain the interactions that pass the filters and used for analysis and annotation.interactionAnnotation.txt
This file is an extension of the HOMER interaction format that includes 16 additional columns with annotation information describing the regions at each end of the interaction:
Column#) Description(Peak/Region 1 or 2)
21) Total Number of Significant Interactions at region(1) - how many other interactions use the same region endpoint
22) Total Number of Significant Interactions at region(2)
23) Annotation(1) - basic annotation from annotatePeaks.pl
24) Detailed Annotation(1) - detailed annotation from annotatePeaks.pl
25) Distance to TSS(1)
26) Nearest PromoterID(1)
27) Gene Name(1)
28) Gene Alias(1)
29) Gene Description(1)
30) Annotation(2)
31) Detailed Annotation(2)
32) Distance to TSS(2)
33) Nearest PromoterID(2)
34) Gene Name(2)
35) Gene Alias(2)
36) Gene Description(2)
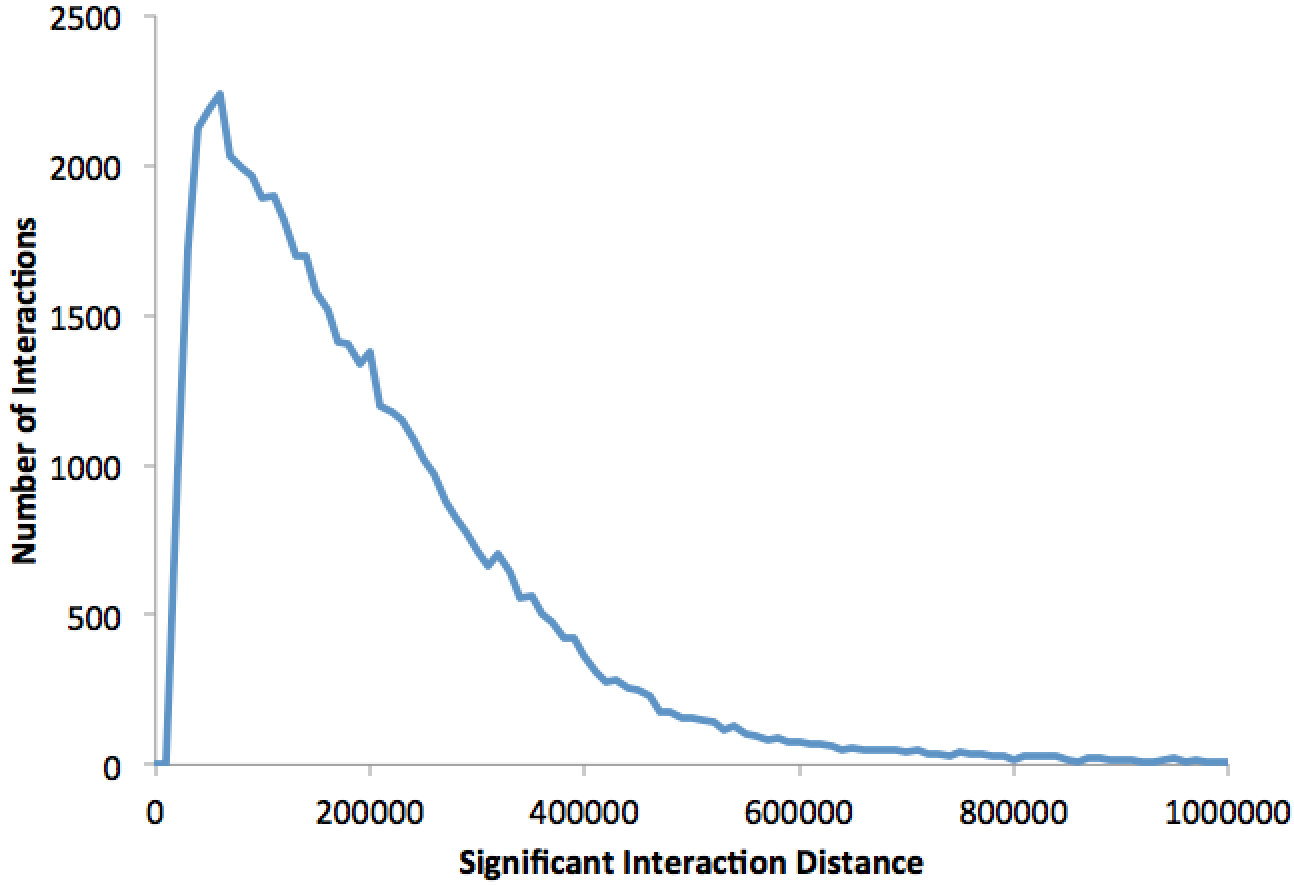
The "Total Number of Significant Interactions at region" described how many other interactions originate from the same region/endpoint. The "Annotation" and "Detailed Annotation" correspond to the basic and full annotations from annotatePeaks.pl.lengthDist.txt
NOTE: If you don't care too much about the annotation part, you can put "none" as the genome, and this part will be skipped (fields will be replaced with "NA").
This file contains a histogram showing the distribution of interaction lengths. Graphing the file in Excel will produce something like the following:peaks.txt
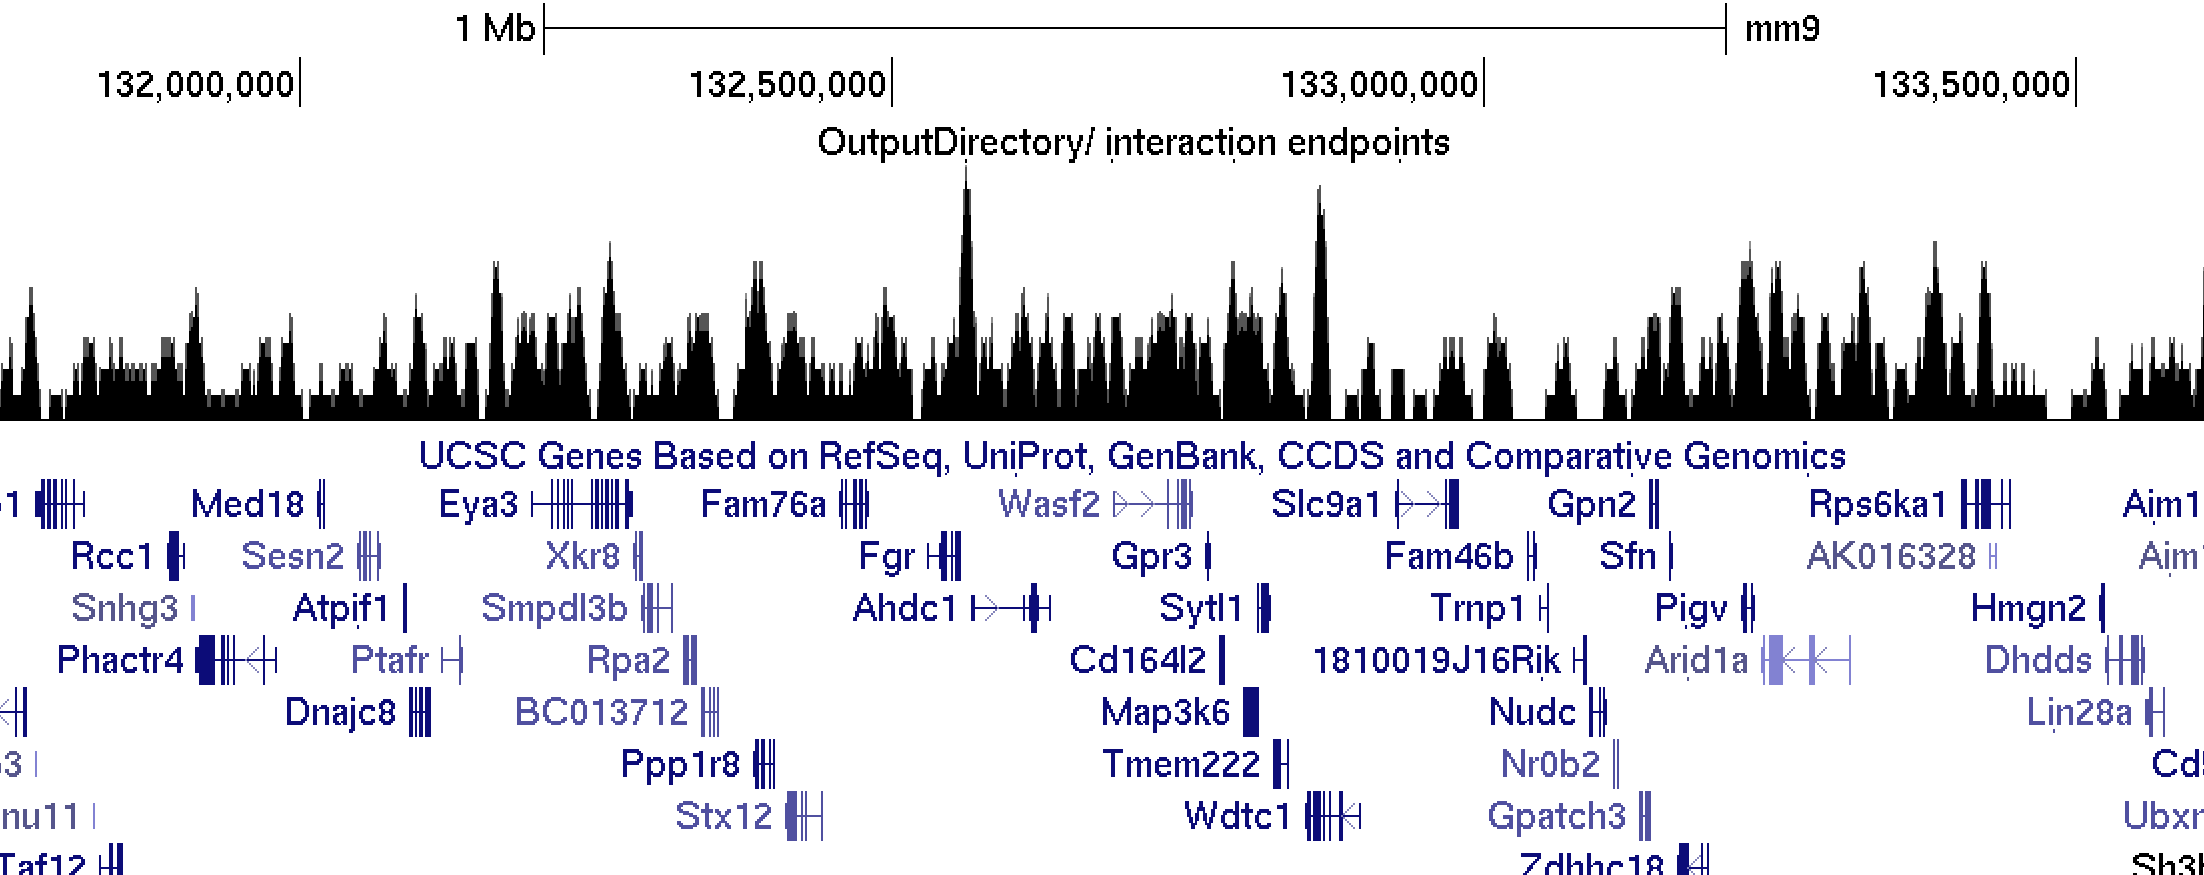
Peak file containing all of the unique endpoint positions. The 7th column indicates how many interactions connect to that peak position.endpoint.bedGraph
This file produces a coverage track of interaction endpoints. If you load this up to UCSC, it will look something like this:endpoint.bedGraph.peaks
This peak file is an exploratory file that attempts to identify hubs directly from the peaks in the endpoint.bedgraph file that exceed the "-hubCount <#>" threshold (default: 5)
hubs.gt#.interactions.txt
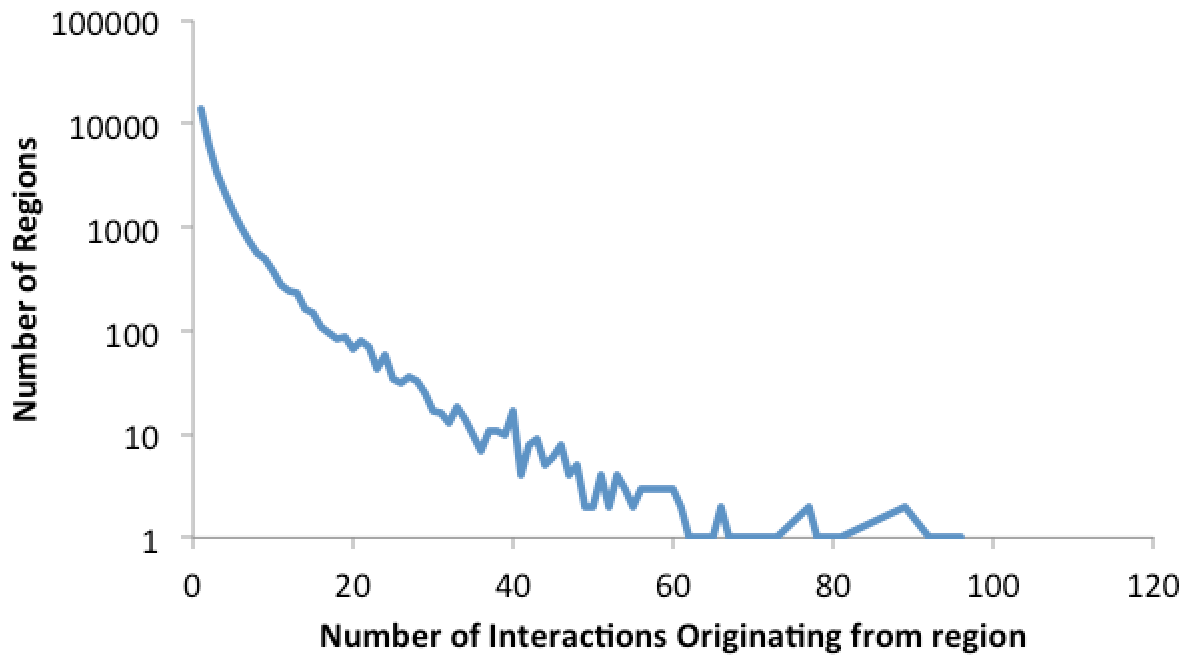
This file is a peak file that contains regions that have more than 5 interactions connecting to that region. This allows you to focus your attention on highly connected regions if you want. To change the number of interactions required to designate a hub, use the "-hubCount <#>" option.hubs.distribution.txt
This file contains a histogram describing the distribution of interactions per unique region. Graphing it in Excel looks something like:
Filtering Options
As mentioned above, one of the main purposes for the filtering options is so that liberal cutoffs for the p-value and z-score can be selected when running the analyzeHiC or findHiCInteractionsByChr.pl command to find the initial set of interactions. Once this large list of possible interactions is found, the p-value and z-score cutoffs can be changed/optimized in the annotateInteractions.pl command to avoid rerunning the other commands, which can be very time consuming.
Interaction Confidence:
-pvalue <#> : filter out interactions with p-value greater than #
-zscore <#> : filter out interactions with z-score less than #
Interaction Length:
-minDist <#> : filter out interactions spaced less than # bp - set > 300 million for only inter-chromosomal interactions
-maxDist <#> : filter out interactions spaced more than # bp, will remove inter-chromosomal interactions if set
Interaction Confidence Vs. Background:
-dpvalue <#> : filter out interaction with p-value vs. background Hi-C experiment greater than #
-dzscore <#> : filter out interaction with z-score vs. background Hi-C experiment less than #
Filtering Regions:
-filter <peakfile> : only look at interactions with endpoints in overlapping with peak in the file
-filter2 <peakfile> : only look at interactions connecting peaks in "-filter" file to the "-filter2" file
Feature Enrichment at Interaction Endpoints
HOMER can compute feature enrichment calculations with your interactions. Simply add the "-p <peak/BED file1> [peak/BED file2]..." to the annotateInteractions.pl command. You can add as many peaks as you want to be considered. Below is an example:
annotateInteractions.pl bcell-Interactions.txt mm9 AnnotationOutputDirectory/ -p tss.peaks.txt ctcf.peaks.txt pu1.peaks.txtAdding the "-p ..." option will initiate three changes to the output of the program:
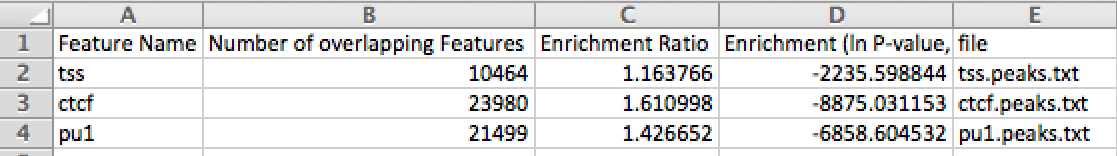
1. Creation of a "featureEnrichment.txt" file in the output directory. This uses mergePeaks to assess the significance of overlap between the interaction endpoints and each of the peak files. When opened in Excel, the output looks like this:
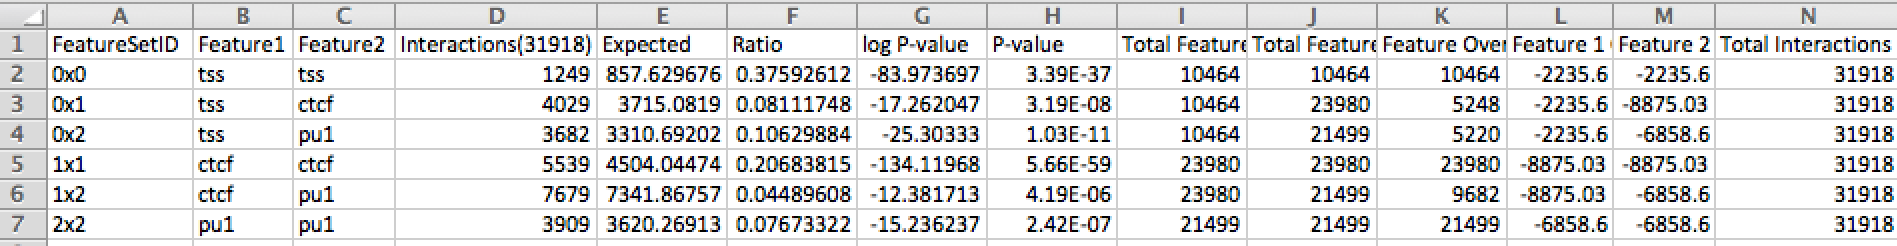
2. Creation of a "pairwiseFeatureEnrichment.txt" file in the output directory. The program annotate the interaction endpoints of each significant interaction and check if any of the feature peak files overlaps with the interaction endpoints. It will then quantify how often each feature is "connected" to each other feature by an interaction. annotateInteractions.pl will then assess if a connection between the features is over- or under-represented given the general enrichment for each feature in the data set. The output file looks like this (+ logp enrichment indicate under-represented connections):
3. The interactionAnnotation.txt file will have one new column at the far right that will give the interaction codes that match the first column of the pairwiseFeatureEnrichment.txt file. In brief, each file is peak file is given an ID number (starting with 0, 1, 2...). Interactions that link peak features are assigned with the code (#x#, e.g. 0x0, 0x2, 1x2, etc.). For example, if an interaction is assigned the code 0x2 from above, then the interaction connects a TSS and PU.1 peak.
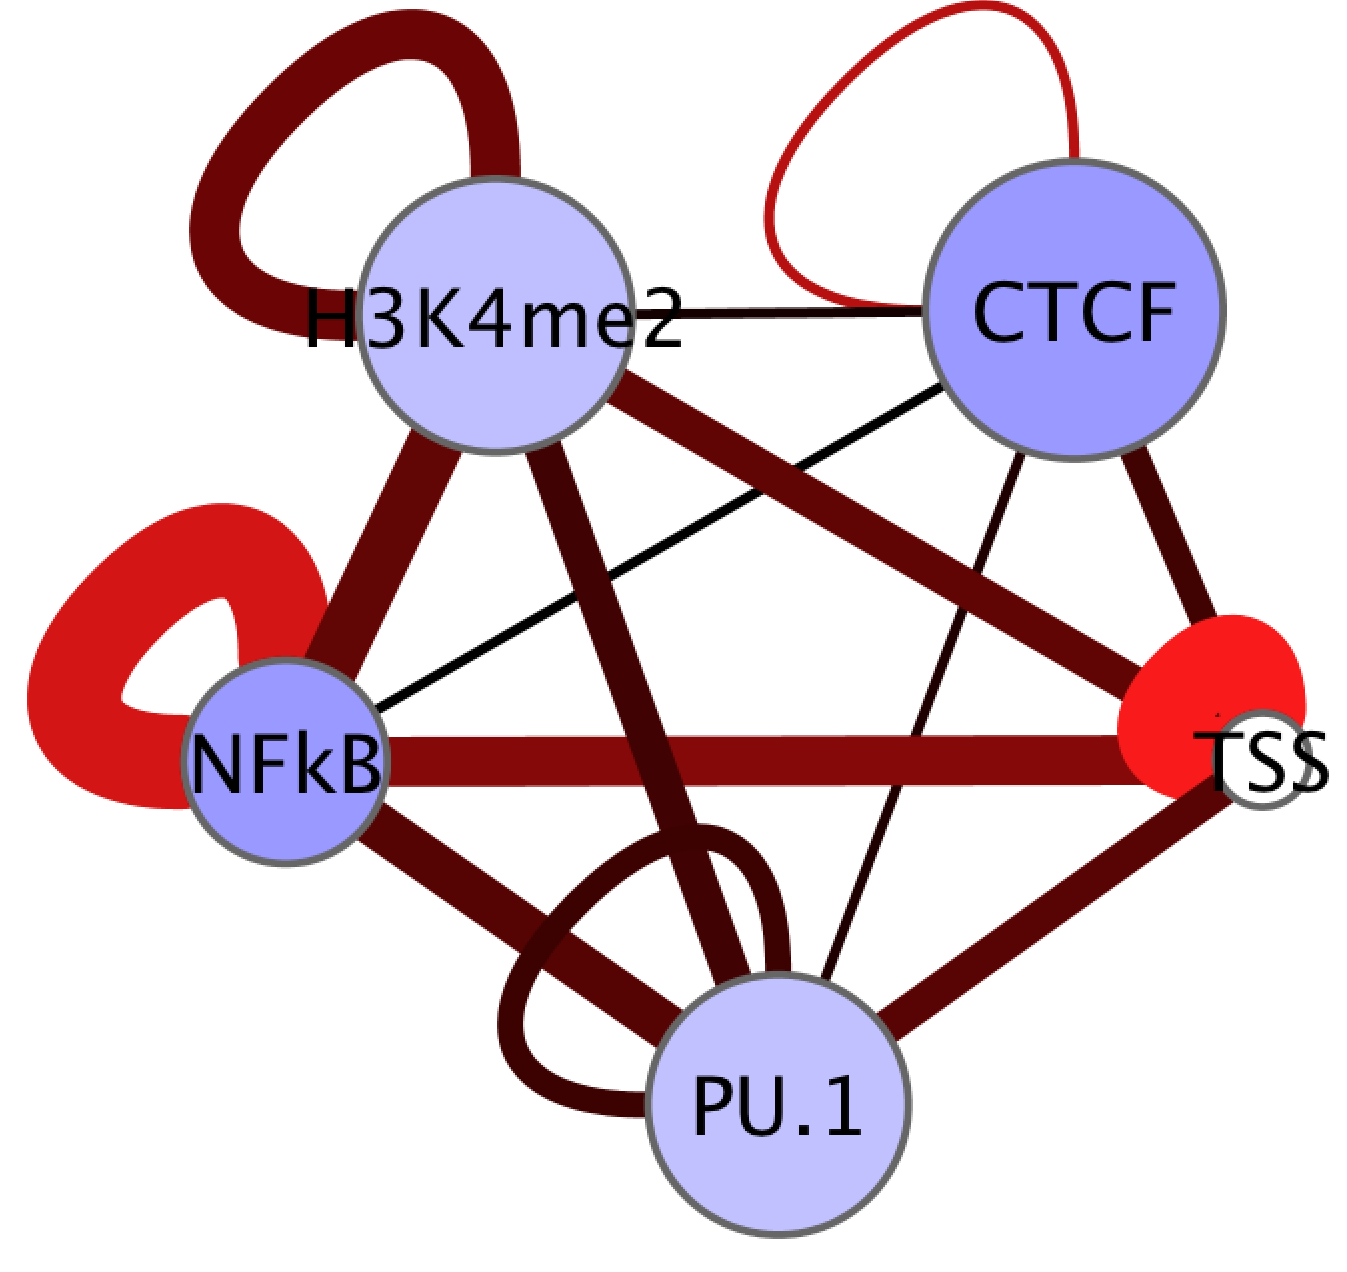
Visualizing Feature Enrichment with Cytoscape
It's hard to appreciate the pairwise feature enrichment in an excel table. The good news is that there is a great visualization tool called Cytoscape that can help out with that. HOMER's support for Cytoscape is a little clumsy (feedback on a more efficient way to setup the input files would be appreciated!).
When HOMER calculates feature enrichment, it will produce six files in the output directory staring with the name "cytoscape". These files are tab-delimited text files formatted to be used with Cytoscape. To load the network, follow these instructions:
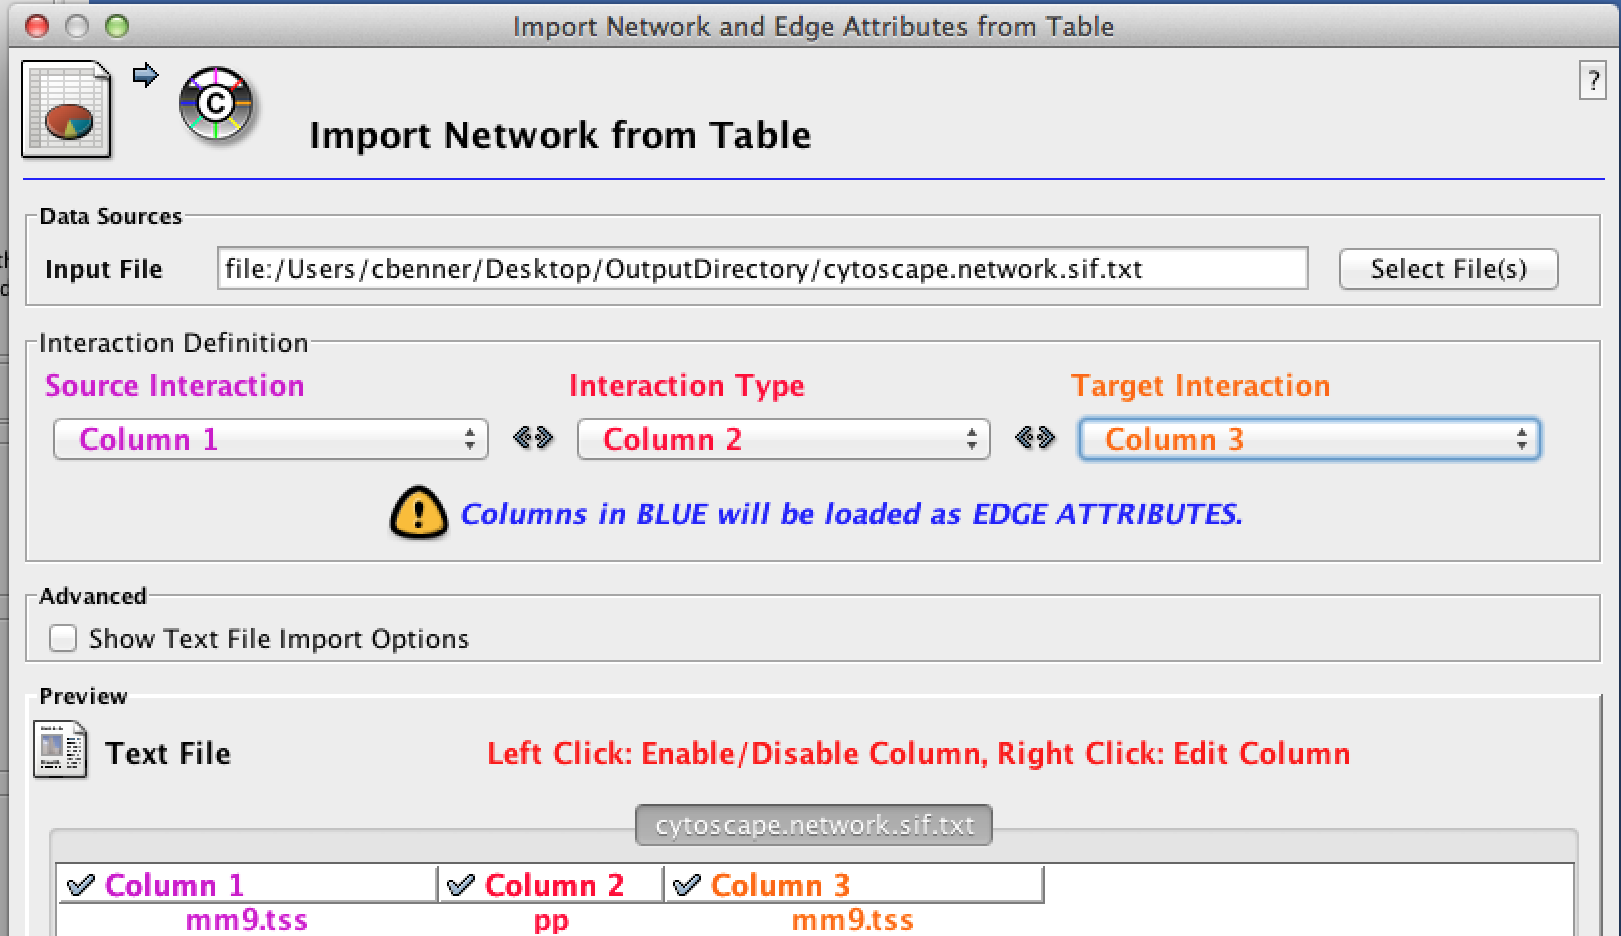
- Go to File -> Import -> Network From Table (Text/MS Excel) For the file, select the "cytoscape.network.sif.txt" file. In the "Interaction Definition" box, set the Source Interaction to column 1, the Interaction Type to column 2, and the Target Interaction to column 3:
- Next go to File -> Import -> Node Attributes... and load the "cytoscape.node.logp.txt" file. Do the same for the other cytoscape.node.* files (cytoscape.node.size.txt, cytoscape.node.ratio.txt). These files correspond to the values for general feature enrichment (i.e. the featureEnrichment.txt file [size is the total number of regions overlapping with each set of peaks)
- Then go to File -> Import -> Edge Attributes... and load the "cytoscape.edge.logp.txt" file. Do the same for the other cytoscape.edge.* files (cytoscape.edge.ratio.txt). These values correspond to the pairwise feature enrichment values.
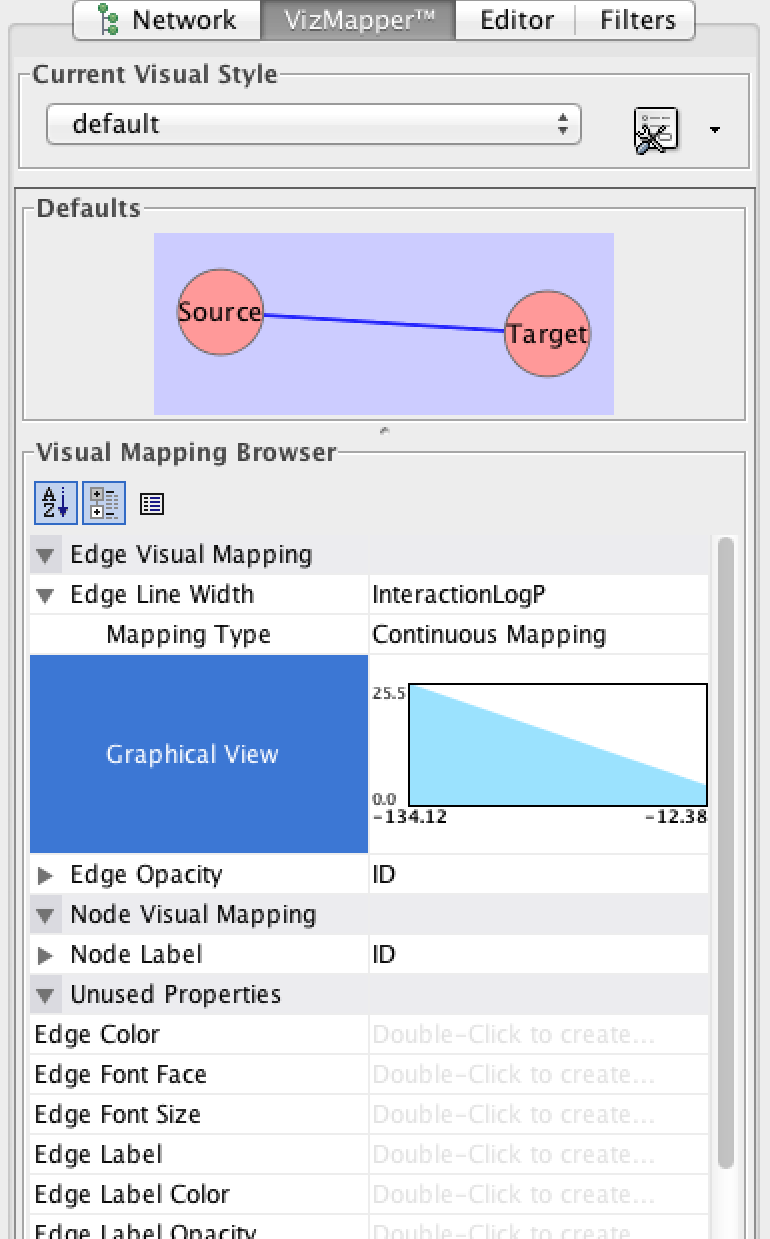
- Clicking on the network diagram should now reveal attributes in the "Data Panel" at the bottom of the screen. Next, to make the network pretty, click on the "VisMapper" on the left side of the screen. From here you can customize how your network displays the data. For example, click on the "Edge Line Width" and double click to activate it.
You can choose which attribute you want to visualize and select the appropriate parameters.
- Takes awhile the first time to play with and make it look right... Good luck!
Modifying the Background for Feature Enrichment
By default, annotateInteractions.pl assumes your interactions were found by searching the entire genome. If you are analyzing a subset, you need to specify what was used with one of the following options:
-pos <chrN:XXX-YYY> : specific a specific region used for analysis
-gsize <#> : set the genome size used for significance calculations
-bgp <peak/BED file> : peaks used to find interactions from.
Miscellaneous/Specialized Analysis
Compare Interactions
If you have two interaction files, add "-i <HOMER interaction file2>" to the end of your annotateInteractions.pl command, and the 2nd interaction file will be compared to the first one, and only the common interactions will be analyzed. Common interactions are defined as interactions where the endpoints at each end are overlapping with each other (with the resolution size).
Connecting Features with Interactions
Lets say you have two peak files, maybe one called "enhancers.txt" and the other "promoters.txt", and you want to see which of the peaks in one of the files is connected to peaks in the other by significant interactions. If you add the "-connect <peak/BED file1> <peak/BED file2>" to the command, a "mapping" file will be sent to stdout. For example:
annotateInteractions.pl bcell-Interactions.txt mm9 AnnotationOutputDirectory/ -connect TSS.txt Enhancers.txt > outputMap.txt
The outputMap.txt file will contain 3 columns, the peakID from the first peak file (column1), the peakID from the 2nd file (column2), and the distance between them (3rd column). There could be many mappings for each peak, so each peak may appear multiple times in the file.
Manually Specifying Circos Edge Widths
The next sections discusses how to visualize interactions using Circos. However, you might find that it's difficult to set the width of the edges yourself. If you modify a HOMER interaction file manually and put the desired width of the edges in the file, you can run annotateInteractions.pl with the "-circos" option. This will output a Circos formatted interaction file. More on this in the next section...
Command Line options for annotateInteractions.pl
Usage: annotateInteractions.pl <interaction file> <genome version> <output directory>[additional options]
General Options:
-res <#> (Resolution of analysis, default: auto detect)
-hubCount <#> (Minimum number of interactions to define a hub, default: 5)
Filtering Options:
-minDist <#> (filter out interactions spaced less than # bp - set high for only interchr)
-maxDist <#> (filter out interactions spaced more than # bp, will remove interchr)
-pvalue <#> (filter out interactions with p-value greater than #)
-dpvalue <#> (filter out interactions with p-value (vs bg) greater than #)
-zscore <#> (filter out interactions with zscore less than #)
-dzscore <#> (filter out interactions with zscore (vs bg) less than #)
-filter <peakfile> (only look at interactions with endpoints in peakfile)
-filter2 <peakfile2> (only look at interactions connecting -filter and -filter2 peak files)
Enrichment Options:
-p <peak file 1> [peak file 2] ... (Check overlap with peak files)
Special Operations:
-circos (Convert interactions to circos interactions format - stdout)
-i <interaction file2> [interaction file3] ... (Compare 1st file interactions to these)
-connect <peakFile1> <peakFile2> (returns association table between sets of peaks)
-pout (Convert interactions to a non-redundant peak file, sent to stdout)
Specifying Background (i.e. regions used to find interactions - default: whole genome)
-gsize <#> (size of genome, default: 2e9)
-pos chrN:XXX-YYY (specific, continuous region)
-bgp <peak file> (peak file)

Can't figure something out? Questions, comments, concerns, or other feedback:
cbenner@ucsd.edu