
HOMER
Software for motif discovery and next-gen sequencing analysis
Visualizing data in a Genome Browser
The ability to visualize your raw sequencing aligned to the
genome is enabled through the use of genome browsers.
Visualizing your data is incredibly important - it enables
you to investigate your data and get a feel for how it
"looks". This is incredibly important for quality
control - programs such as FASTQC, HOMER, etc. can only do
so much. Years of experience and knowledge of
biological systems make the human brain a good tool to
investigate data quality. Also, visualization of
sequencing data may help you come up with new ideas about
how to analyze the data.Popular Genome Browsers:
UCSC Genome Browser
This is an awesome genome browser that puts lots of different information at your finger tips, including lots of published studies and ENCODE data. Big pluses: data integration. Negatives: slower (web based), a little more difficult to upload large custom data sets.
IGV (Integrative Genome Viewer)
This browser runs locally on your own computer (the more memory you have the better). It is Java based, and is easy to use on almost any computer. It doesn't have the same degree of shared information available as UCSC, but it is much faster for browsing across the genome. Also, it is better for looking at individual reads/looking for variants.Others
There are tons of genome browsers out there that serve many different needs. For a list, check out this link.
Types of custom data files
A general list of common file formats can be found here. Popular formats are shown below:
- bed - (*.bed) - BED files are very basic as they simply describe a simple region in the genome. They are usually used to describe ChIP-Seq peaks and things of that nature. Nearly every genome browser supports visualization of BED files.
- wiggle - (*.wig) - Wiggle files are used to display quantitative information across genomic regions. Usually used to display read depth from ChIP- or RNA-seq experiments. Wiggle format is compact and displays data at regular intervals.
- bedGraph - (*.bedGraph) - Similar to Wiggle files, these are used to display quantitative data across genomic regions. They use variable length intervals instead of constant intervals found in wiggle files, and are usually a little bigger in size.
- bam - (*.bam) - Display individual reads. Bam files need to be sorted, and they need to have an index file along with the bam file to help the genome browser efficiently find reads in the bam file. It's best to use a local browser like IGV when visualizing bam files.
- GFF/GTF - (*.gff *.gtf) - Extensible file formats for specifying spliced transcripts and genes. Transcript assembly programs like cufflinks will generate GTF files that you can then upload to a genome browser.
Server Resident Files:
In the case of web-based genome browsers such as UCSC, it can be difficult to upload large data files. To get around this issue, UCSC set up protocols to allow you to post your files on a webserver and then create a track that "points" to the location of your files. This requires a working webserver, but can be a powerful way to visualize bigwig files. (more info)
Creating genome browser files
There are a bunch of specialized programs for creating genome browser files. For example, HOMER has specialized routines for creating browser files. Often, the output of a program is already suited to be loaded into a genome browser. For example, cufflinks generates a "transcripts.gtf" file. Macs creates a peak bed file. Other common examples:
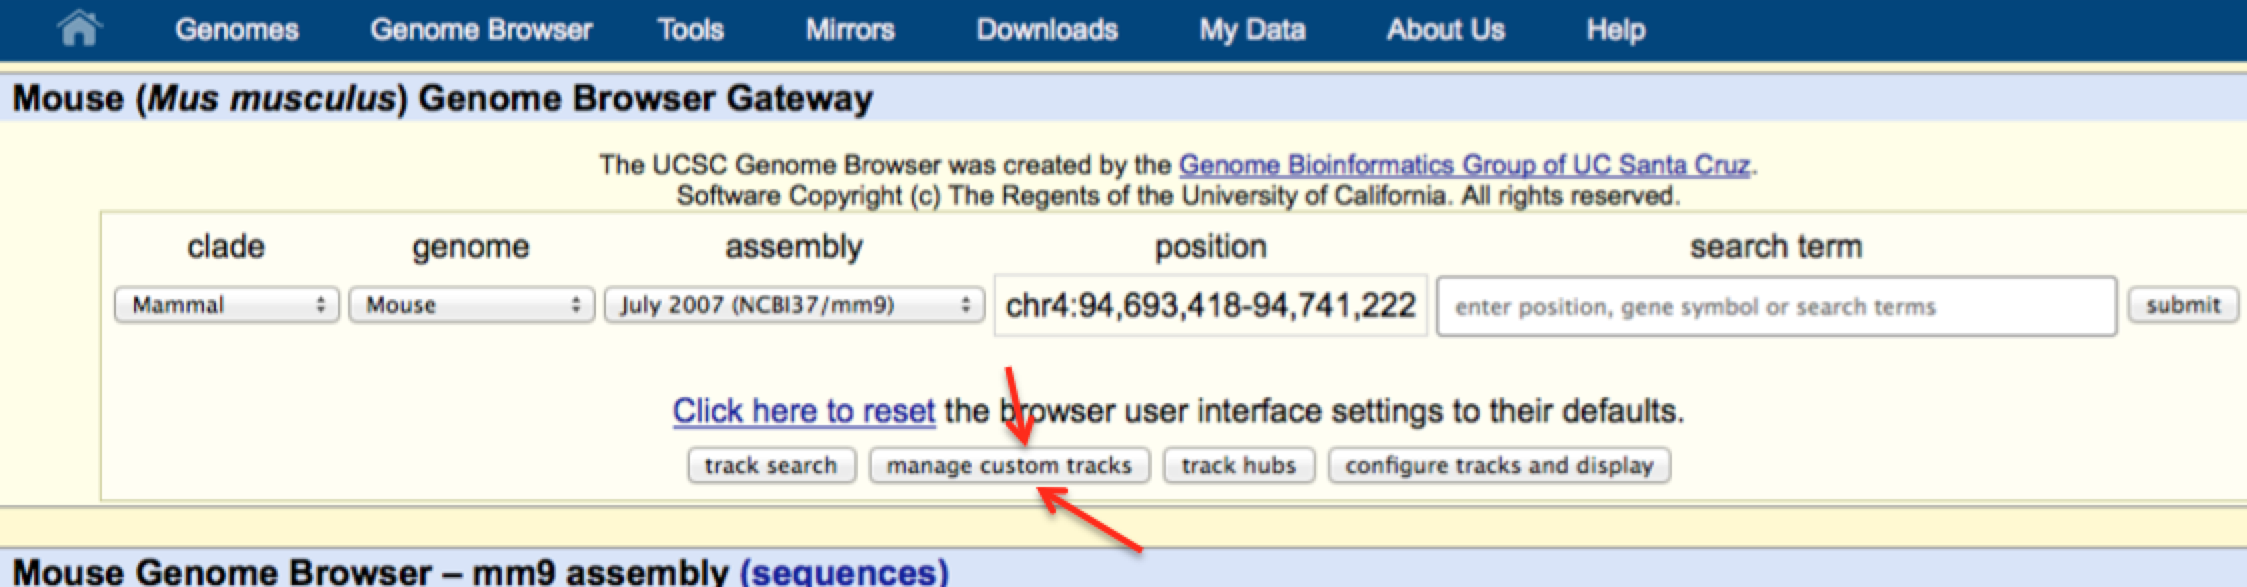
Loading custom data into the UCSC Genome Browser
To look at your own data using the UCSC Genome Browser, click on the "Genomes" at the top and look for the "Add Custom Tracks" or "Manage Custom Tracks" button:
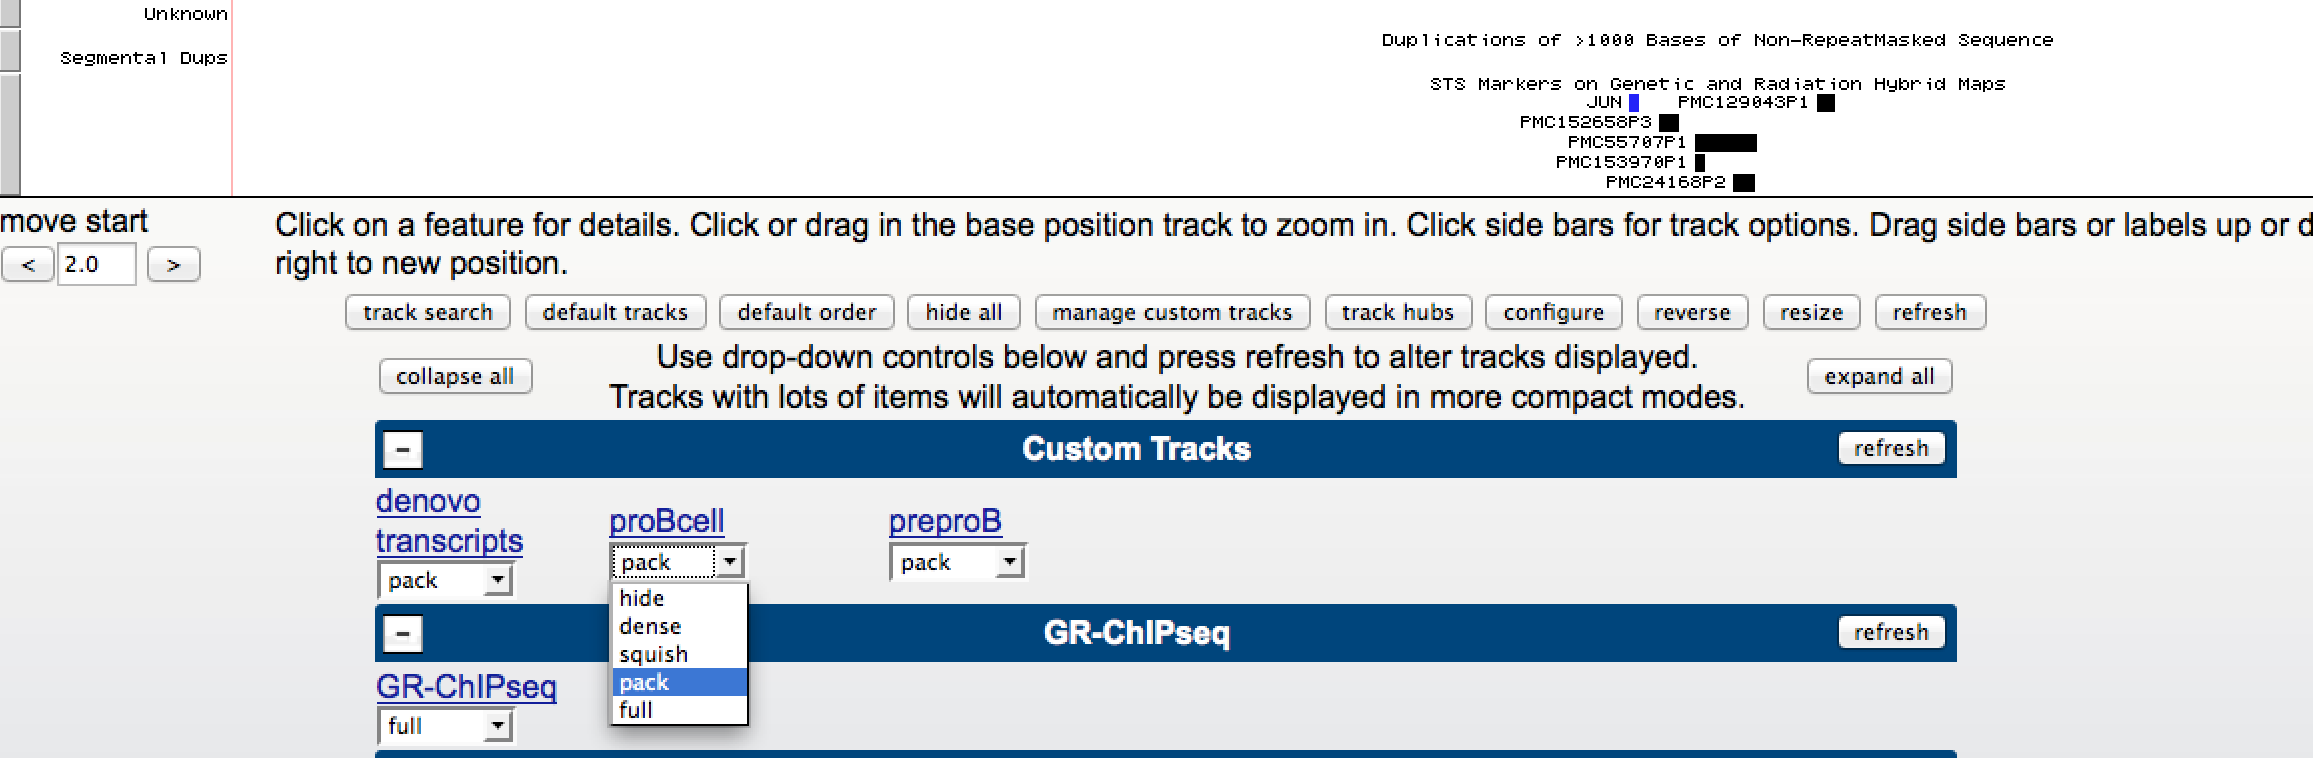
After uploading your track, the data should appear in the genome browser. At the bottom of the browser image you'll find a variety of track settings. The section at the top controls the settings for custom tracks:
You can change how the track is visualized by clicking on the drop down menu, shown above. You can also click on the 'blue' link name and change other custom settings.
Visual Quality Control
There are several things to look out for when viewing your data in the browser. Below is a checklist to help guide you.
- Look for spikes in the data. These may be caused by contaminants, and may cause problems with data analysis.
- ChIP-Seq
- Are there nice, defined peaks in the data? Or are there regions of continuous coverage (histone marks)?
- Are there reads on all expected chromsomes?
- Does the pattern match the experiment?
- TFs: Spikes of enrichment near the TSS and distal regulatory elements
- H3K4me3 - enriched near TSS
- H3K4me1/2, H3/H4ac, DNase - enriched near TSS and near distal regulatory elements
- H3K36me3 - enriched across gene bodies
- H3K27me3 - enriched near CpG Islands of inactive genes
- H3K9me3 - enriched across broad domains and repeat elements
- Is the background low, or almost as high as the expected peaks?
- RNA-Seq
- Are most reads found on exons? Or is there a lot of reads in introns/other regions?
- Do you have even read coverage across exons, or is it full of strong spikes?
- Is there a 3' or 5' bias in the data?
- If strand specific, is it the correct strand?

Can't figure something out? Questions, comments, concerns, or other feedback:
cbenner@salk.edu