
HOMER
Software for motif discovery and next-gen sequencing analysis
Finding
Enriched Peaks, Regions, and Transcripts
HOMER contains a program called findPeaks that performs all of the peak
calling and transcript identification analysis. (Not
to be confused with another peak finding program called FindPeaks,
which was also very creatively named). Finding peaks
is one of the central goals of any ChIP-Seq experiment, and
the same basic principles apply to other types of sequencing
such as DNase-Seq. The basic idea is to identify
regions in the genome where we find more sequencing reads
than we would expect to see by chance. There are
number of different approaches one can use to find peaks,
and correspondingly there are many different methods for
identifying peaks from ChIP-Seq experiments. It is not
required that you use HOMER for peak finding to use the rest
of the tools included in HOMER (see below).findPeaks has 7 basic modes of operation:
histone
super
groseq
tss
dnase
mC
HOMER does not perform de novo transcript isoform detection from spliced RNA-Seq. There is already a bunch of great work on this topic, and differential isoform detection, etc. with RNA-seq is quite difficult. We recommend the Tophat/Cufflinks family of programs for RNA-Seq isoform detection.
Using findPeaks
Where the first argument must be the tag directory (required). The other options are not required. The "-style <...>" option can be either "factor", "histone", or one of a number of specialized types. Use the "-i" option to specify a control experiment tag directory (good idea when doing ChIP-Seq).
Output files
If "-o auto" is specified, the peaks will be written to:
"<tag directory>/regions.txt" (-style histone)
"<tag directory>/transcripts.txt" and "<tag directory>/transcripts.gtf" (-style groseq)
The top portion of the peak file will contain parameters and various analysis information. This output differs somewhat for GRO-Seq analysis, and is explained in more detail later. Some of the values are self explanatory. Others are explained below:
# Peak finding parameters:
# tag directory = Sox2-ChIP-Seq
#
# total peaks = 10280
# peak size = 137
# peaks found using tags on both strands
# minimum distance between peaks = 342
# fragment length = 132
# genome size = 4000000000
# Total tags = 9908245.0
# Total tags in peaks = 156820.0
# Approximate IP efficiency = 1.58%
# tags per bp = 0.001907
# expected tags per peak = 0.523
# maximum tags considered per bp = 1.0
# effective number of tags used for normalization = 10000000.0
# Peaks have been centered at maximum tag pile-up
# FDR rate threshold = 0.001000
# FDR effective poisson threshold = 0.000000
# FDR tag threshold = 8.0
# number of putative peaks = 10800
#
# size of region used for local filtering = 10000
# Fold over local region required = 4.00
# Poisson p-value over local region required = 1.00e-04
# Putative peaks filtered by local signal = 484
#
# Maximum fold under expected unique positions for tags = 2.00
# Putative peaks filtered for being too clonal = 36
#
# cmd = findPeaks Sox2-ChIP-Seq -style factor -o auto
#
# Column Headers:
Genome size represents the total effective number of mappable bases in the genome (remember each base could be mapped in each direction)
Approximate IP effeciency describes the fraction of tags found in peaks versus. genomic background. This provides an estimate of how well the ChIP worked. Certain antibodies like H3K4me3, ERa, or PU.1 will yield very high IP efficiencies (>20%), while most rand in the 1-20% range. Once this number dips below 1% it's a good sign the ChIP didn't work very well and should probably be optimized.
Below the header information are the peaks, listed in each row. Columns contain information about each peak:
- Column 1: PeakID - a unique name for each peak (very important that peaks have unique names...)
- Column 2: chr - chromosome where peak is located
- Column 3: starting position of peak
- Column 4: ending position of peak
- Column 5: Strand (+/-)
- Column 6: Normalized Tag Counts - number of tags
found at the peak, normalized to 10 million total
mapped tags (or defined by the user)
- Column 7: (-style factor): Focus Ratio - fraction of tags found appropriately upstream and downstream of the peak center. (see below)
- (-style histone/-style groseq): Region Size - length of enriched region
- Column 8: Peak score (position adjusted reads from
initial peak region - reads per position may be
limited)
- Columns 9+: Statistics and Data from filtering
bed2pos.pl peakfile.bed > peakfile.txt
Finding Transcription Factor Peaks with HOMER
i.e. findPeaks ERalpha-ChIP-Seq/ -style factor -o auto -i MCF7-input-ChIP-Seq
Identification of Putative Peaks
findPeaks loads tags from each chromosome, adjusting them to the center of their fragments, or by half of the estimated fragment length in the 3' direction (this value is also automatically estimated from the autocorrelation analysis). The fragment length can be specified manually using the "-fragLength <#>" option. It then scans the entire genome looking for fixed width clusters with the highest density of tags. As clusters are found, the regions immediately adjacent are excluded to ensure there are no "piggyback peaks" feed off the signal of large peaks. By default, peaks must be greater than 2x the peak width apart from on another (set manually with "-minDist <#>"). This continues until all tags have been assigned to clusters.
After all clusters have been found, a tag threshold is established to correct for the fact that we may expect to see clusters simply by random chance. Previously, to estimate the expected number of peaks for each tag threshold, HOMER would randomly assign tag positions and repeat the peak finding procedure. HOMER now assumes the local density of tags follows a Poisson distribution, and uses this to estimate the expected peak numbers given the input parameters much more quickly. Using the expected distribution of peaks, HOMER calculates the expected number of false positives in the data set for each tag threshold, setting the threshold that beats the desired False Discovery Rate specified by the user (default: 0.001, "-fdr <#>").
HOMER assumes the total number of mappable base pairs in the genome is 2,000,000,000 bp (** change from previous version. here 2e9 assumes the actual number of mappable positions is actually 2x [think + and - strand]) , which is "close enough" for human and mouse calculations. You can specify a different genome size using "-gsize <#>". HOMER also uses the reads themselves to estimate the size of the genome (i.e. that highest tag position on each chromosome). If this estimate is lower than the default, it will use that value to avoid using too large of a number on smaller genomes (For example, if you used findPeaks on drosophila data without specifying "-gsize").
It is important to note that this false discovery rate controls for the random distribution of tags along the genome, and not any other sources of experimental variation. Alternatively, users can specify the threshold using "-poisson <#>" to calculate the tag threshold that yields a cumulative poisson p-value less than provided or "-tagThreshold <#>" to specify a specific number tags to use as the threshold.
Filtering Peaks
Using Input/IgG Sequencing as a Control
HOMER uses two parameters to filter peaks against a control experiment. First, it uses a fold change (which is sequencing depth-independent), requiring each putative peak to have 4-fold more normalized tags in the target experiment than the control (or specify a different fold change with "-F <#>"). In the case where there are no input tags near the putative peak, HOMER automatically sets these regions to be set to the average input tag coverage to avoid dividing by zero. HOMER also uses the poisson distribution to determine the chance that the differences in tag counts are statistically significant (sequencing-depth dependent), requiring a cumulative poisson p-value of 0.0001 (change with "-P <#>"). This effectively removes peaks with low tag counts for which there is a chance the differential enrichment is found simply due to sampling error.
One modification in recent versions of HOMER is the in the size of region used to compare experiment with control tags. Since control experiments are not always performed the same way, e.g. different fragment lengths, it helps to enlarge the peak size for the purposes of comparing experiments to ensure control reads found immediately outside of the peak region are still considered. By default, HOMER enlarges peaks by 2x to search the control experiment (change with "-inputSize <#>"). This may reduce specificity when trying to identify certain types of peaks.
Filtering Based on Local Signal
To deal with this, HOMER will filter peaks based on the local tag counts (similar in principle to MACS). Be default, HOMER requires the tag density at peaks to be 4-fold greater than in the surrounding 10 kb region. This can be modified using "-L <#>" and "-localSize <#>" to change the fold threshold and size of the local region, respectively. As with input filtering, the comparison must also pass a poisson p-value threshold of 0.0001, which can be set using "-LP <#>" option.
Filtering Based on Clonal
Signal
Disabling Filtering
Finding Variable Length Transcription Factor Peaks
For those interested in finding peaks that are more conforming to the regions of enrichment, add "-region" to the END of the command. The command line is parsed sequentially, so putting it at the end makes sure other options will not overwrite it. You can also get finer resolution by increasing "-regionRes <#>".
Peak Centering and Focus Ratios
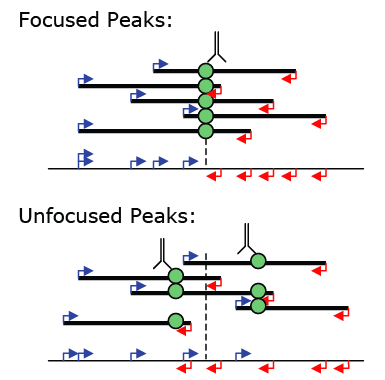
To isolate focused peaks, you can use the getFocalPeaks.pl tool:
i.e. getFocalPeaks.pl ERpeaks.txt 0.90 > ERfocalPeaks.txt
Finding Enriched Regions of Variable Length
i.e. findPeaks H3K4me1-ChIP-Seq/ -style histone -o auto -i Input-ChIP-Seq
If the option "-style histone" or "-region" is specified, findPeaks will stitch together enriched peaks into regions. Note that local filtering is turned off when finding regions. The most important parameters for region finding are the "-size" and "-minDist" (and of course the fragment length). First of all, "-size" specifies the width of peaks that will form the basic building blocks for extending peaks into regions. Smaller peak sizes offer better resolution, but larger peak sizes are usually more sensitive. By default, "-style histone" evokes a peak size of 500.
The second parameter, "-minDist", is usually used to specify the minimum distance between adjacent peaks. If "-region" is used, this parameter then specifies the maximum distance between putative peaks that is allowed if they are to be stitched together to form a region. By default this is 2x the peak size. If you think about histone modifications, the signal is never continuous in enriched regions, with reduced signal due to non-unique sequences (that can't be mapped to) and nucleosome depleted regions. "-minDist" informs findPeaks how big of a gap in the signal will be tolerated for adjacent peaks to be considered part of the same region. (by default "-style histone" sets this to 1000).
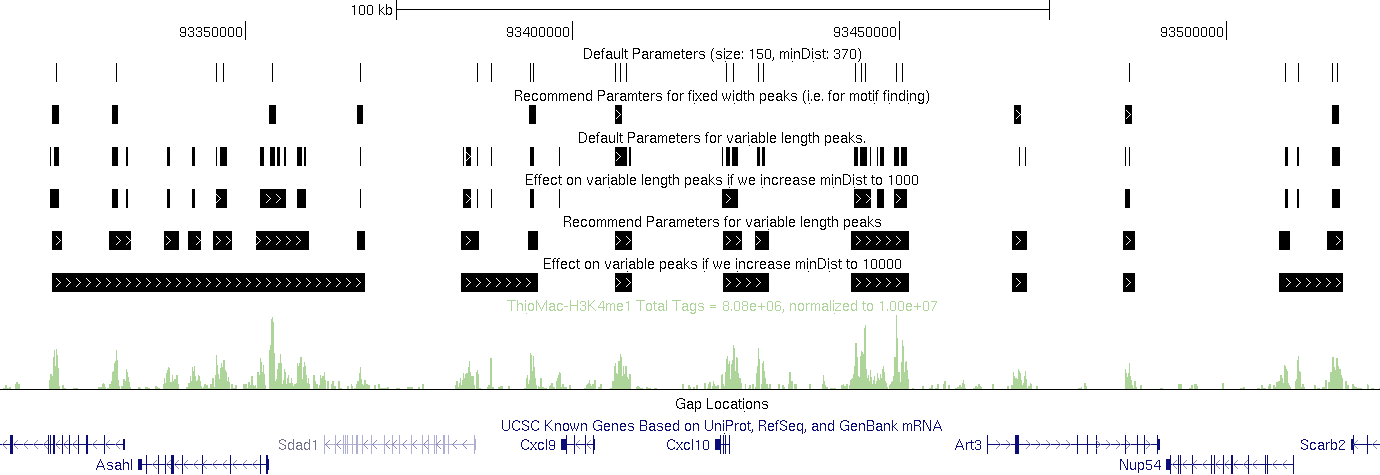
One thing to note is that you may have to play around with these parameters to get the results you want. If you look at the examples below, you could make arguments for using each of the tracks given what you're interested in and how you would define a "region".
For example: (in the example below, the default size comes from the autocorrelation estimate for the Macrophage-H3K4me1 dataset)
Recommend Parameters for fixed width peaks (i.e. for motif finding):
findPeaks Macrophage-H3K4me1/ -i Macrophage-IgG -size 1000 -minDist 2500 > output.txt
Default Parameters for variable length peaks.
findPeaks Macrophage-H3K4me1/ -i Macrophage-IgG -region -size 150 -minDist 370 > output.txt
findPeaks Macrophage-H3K4me1/ -i Macrophage-IgG -region -size 150 -minDist 1000 > output.txt
Recommend Parameters for variable length peaks (H3K4me1 at least).
findPeaks Macrophage-H3K4me1/ -i Macrophage-IgG -region -size 1000 -minDist 2500 > output.txt
Effect on variable peaks if we increase minDist to 10000 (H3K4me1 at least).
findPeaks Macrophage-H3K4me1/ -i Macrophage-IgG -region -size 1000 -minDist 10000 > output.txt
Finding Histone Modification Peaks and Motif Finding
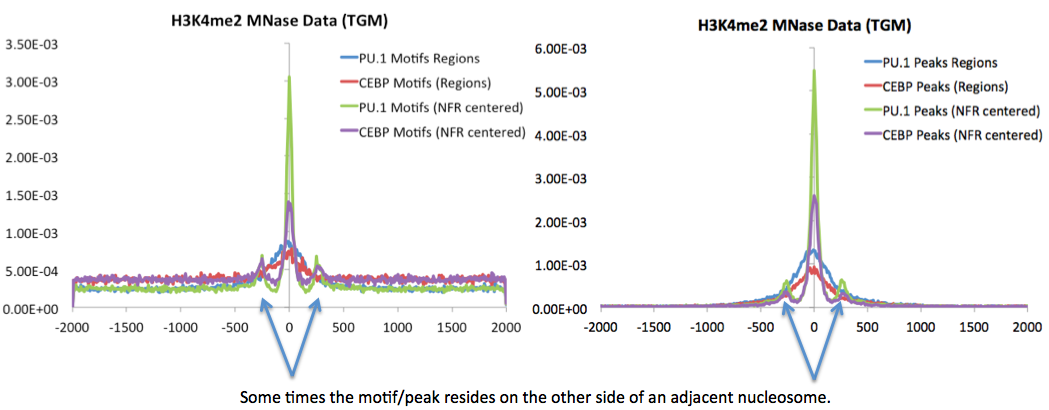
There are two important differences between finding fixed width peaks for transcription factors and histone modifications. The first is the size of the peaks: Most histone modifications should be analyzed using a peak size in the range of 500-2000 usually (i.e. "-size 1000"). Below is an example of the histone mark distribution around transcription factor peaks (i.e. the things you're hoping Motif Finding will identify), which can be used to help estimate the parameters:
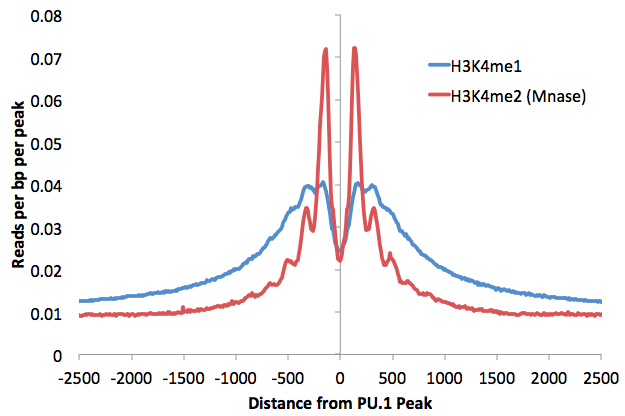
The other is that you should omit the "-center" option (i.e. do not specify "-style factor"). Since you are looking at a region, you do not necessarily want to center the peak on the specific position with the highest tag density, which may be at the edge of the region. Besides, in the case of histone modifications at enhancers, the highest signal will usually be found on nucleosomes surrounding the center of the enhancer, which is where the functional sequences and transcription factor binding sites reside. Consider H3K4me marks surrounding distal PU.1 transcription factor peaks. Typically, adding the -center option moves peaks further away from the functional sequence in these scenarios. An example for finding peaks:
One issue with finding histone modification peaks using the defaults in HOMER is that the Local filtering step removes several of the peaks due to the "spreading" nature of many histone modifications. This can be good and bad. If you are looking for nice concentrated regions of modified histones, the resulting peaks will be a nice set for further analysis such as motif finding. However, if you are looking to identify every region in the cell that has an appreciable amount of modified histone, you may want to disable local filtering, or consider using the "-region" option below e.g.:
Nucleosome Free Regions (NFR) -nfr
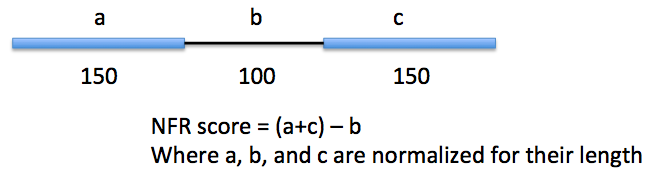
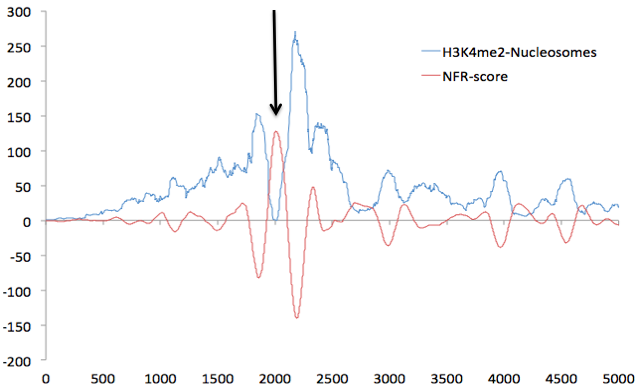
Works much better with MNase treated ChIP-Seq samples. The output file will then be centered on the NFR - this is useful for motif finding. By using NFRs instead of whole regions, you can narrow the search for regulatory elements down the +/- 100 bp instead of +/-500 or 1000 bp. Below is an example of ChIP-Seq peak locations with respect to center of H3K4me2-ChIP-Seq regions generated with and without the "-nfr" flag in Macrophages.
Peak finding and Sequencing Saturation
Finding Super Enhancers
The concept of a 'super enhancer' has gained traction as a way to categorize regions of the genome that are contain several enhancers in close proximity. The concept was pioneered by the Young lab (Whyte et al.). These 'super enhancer' regions are normally located in the vicinity of important genes and can be useful for describing key components of the regulatory landscape of the cell. findPeaks has a 'super enhancer' option built in to help identify these regions in a similar manner to how the Young Lab did it ('-style super').
findPeaks <tag directory> -i <input tag directory> -style super -o auto
findPeaks ES-Med1 -i ES-input -style super -o auto
(resulting super enhancers will be in the file ES-Med1/superEnhancers.txt)
How finding super enhancers works:
Super enhancer discovery in HOMER emulates the original strategy used by the Young lab. First, peaks are found just like any other ChIP-Seq data set. Then, peaks found within a given distance are 'stitched' together into larger regions (by default this is set at 12.5 kb). The super enhancer signal of each of these regions is then determined by the total normalized number reads minus the number of normalized reads in the input. These regions are then sorted by their score, normalized to the highest score and the number of putative enhancer regions, and then super enhancers are identified as regions past the point where the slope is greater than 1. Example of a super enhancer plot:
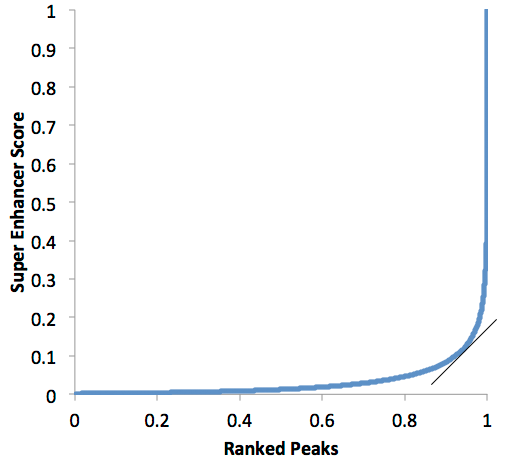
In the plot above, all of the peaks past 0.95 or so would be considered "super enhancers", while the one's below would be "typical" enhancers. If the slope threshold of 1 seems arbitrary to you, well... it is! This part is probably the 'weakest link' in the super enhancer definition. However, the concept is still very useful. Please keep in mind that most enhancers probably fall on a continuum between typical and super enhancer status, so don't bother fighting over the precise number of super enhancers in a given sample and instead look for useful trends in the data.
Super Enhancer Output
The output file is a peak file containing the super enhancers (if you use "-o auto" the peak file named 'superEnhancers.txt' will be placed in the tag directory). If you want to get the "typical" enhancers, use the option "-typical <filename>" to output them to a separate peak file.
Making your own Super Enhancer Plot
Find super enhancers like you normally would, but add the option "-superSlope -1000" - the idea is to include ALL potential peaks as 'super enhancers' so that we can plot them together. Open the resulting peak file in Excel. The 6th column ("Normalized Tag Count") contains the super enhancer score for each region. Simply ploting this column as a line plot will give you a sense of what your plot will look like. To get an official "Young-lab style" plot you'll have to do some Excel algebra to normalize score by the total.
Key parameters for determining super enhancers:
-style super
Required to trigger findPeaks super enhancer routines.
-typical <filename>
If you want findPeaks to output the typical (non-super) enhancers too, specify -typical followed by the desired output file name.
<Tag Directory>
The tag directory you use for super enhancer calculation is probably the most important step. In theory, any data could be used. Normally, you should use either ChIP-Seq for Transcription Factors (Master/Lineage Determining Factors preferably), ChIP-Seq for key co-factors (e.g. Mediator, p300, Brd4, etc.), or enhancer marks (e.g. H3K27ac, H3K4me1/2, etc.). You can combine transcription factors into a single tag directory (makeTagDirectory Combined/ -d TF1/ TF2/ TF3/) too.
-minDist <#>
The maximum distance used to stitch peaks together. By default it will be set to 12500. Setting this larger or smaller will allow super enhancers to expand to larger regions or shrink. If the data is very dense with peaks, it's probably best to keep this value small. If on the other hand the data has very few initial peaks (i.e. less than 10,000), you may need to increase this value to identify more regions.-L <#>
The local fold change is used to identify initial peak by default for super enhancers. However, when using histone marks with super enhancers, you may want to disable this set by setting it to 0 or at least 1.-superSlope <#>
By default Super Enhancers are identified by finding the point in the super enhancer graph where the slope drops below 1. Use this setting to change the slope threshold.-superWindow <#>
To ensure the slope calculation is robust, the local slope is calculated by considering peaks across a 10 peak window.
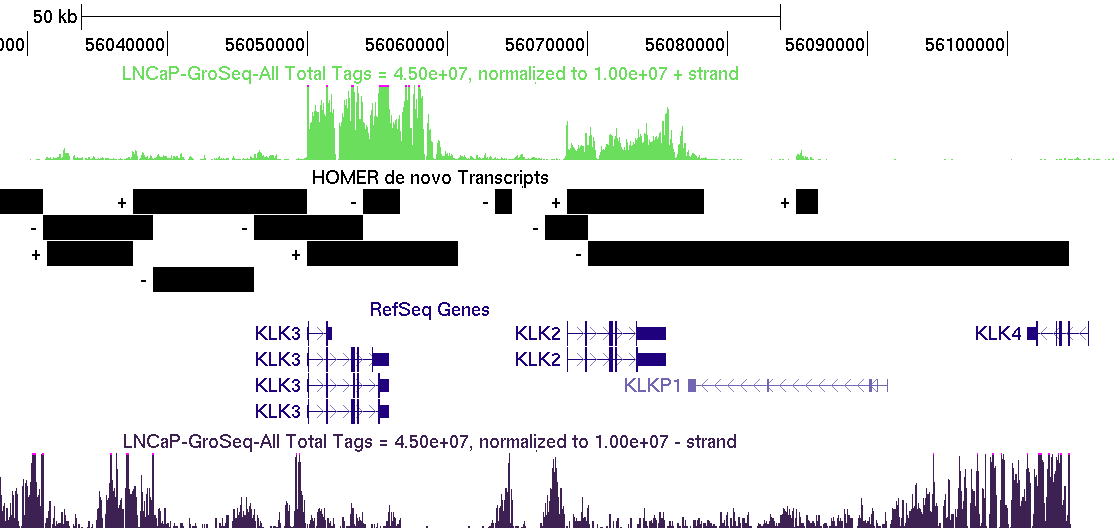
Analyzing GRO-Seq: de novo transcript
identification
i.e. findPeaks Macrophage-GroSeq -style groseq -o auto
GRO-Seq analysis does not make use of an control tag directory
Basic Idea behind GRO-Seq Transcript identification
Important NOTE: Just as with ChIP-Seq, not all GRO-Seq data was created equally. Data created by different labs can have features that make it difficult to have an single analysis technique that works perfectly for each one. As such, there are many parameters to play with the help get the desired results.
A large number of assumptions go into the analysis and are covered in more detail in the GRO-Seq tutorial (coming soon). In a nutshell, findPeaks tracks along each strand of each chromosome, searching for regions of continous GRO-Seq signal. Once it encounters high numbers of GRO-Seq reads, it starts a transcript. If the signal decreases significantly or disappears, the putative transcript is stopped. If the signal increases significantly (and sustainably), then a new transcript is considered from that point on. If the signal spikes, but overall does not increase over a large distance, it is considered an artifact or pause site and not considered in the analysis. Below is a chart that helps explain how the transcript detection works:
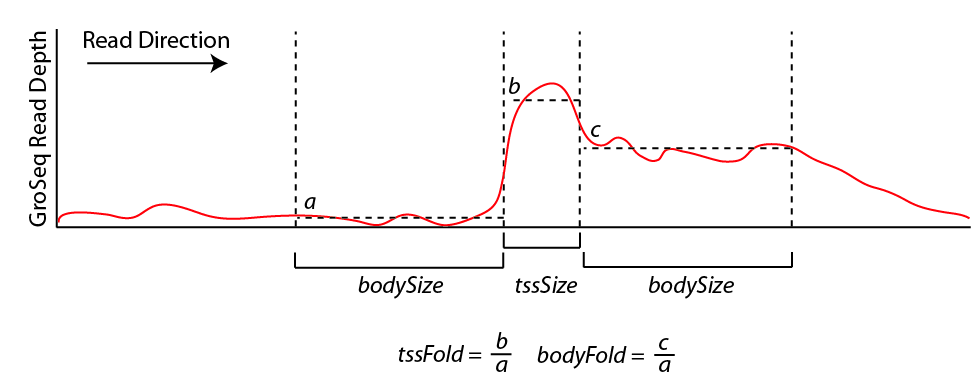
By default, new transcripts are created when the tssFold exceeds 4 and bodyFold exceed 3 ("-tssFold <#>", "-bodyFold <#>"). A small pseudo-count is added to the tag count from region a above to avoid dividing by zero and helps serve to set a minimum threshold for transcript detection ("-pseudoCount <#>", default: 1). Most transcripts show robust signal at the start of the transcript, and the tssFold helps select for these regions with high accuracy. The bodyFold is important for distinguishing between "spikes" in signal and real start sites; if a transcript is real, it's likely that increased levels of transcription follow behind the putative TSS. If the signal is roughly equal before and after the putative TSS, it is more likely to be an artifact.
To increase senstivity, HOMER tries to adjust the size of the bodySize parameter above since it essentially defines the resolution of the detected transcript. If there are a large number of GRO-Seq tags in a region, the bodySize can be small since there is adequate data to estimate the location of the transcript. However, if the data is relatively sparse, the bodySize needs to be large to get a reliable estimate of the level of the transcript. The minimum and maximum bodySizes are 600 and 10000 bp ("-minBodySize <#>", "-maxBodySize <#>"). HOMER uses the smallest bodySize that contains at least x number of tags, where x is determined as the number of tags where the chance of detecting a bodyFold change is less than 0.00001 assuming the read depth varies according to the poisson distribution (adjustable with "-confPvalue <#>", or directly with "-minReadDepth <#>"). The basic idea is that the threshold for tag counts must be high enough that we don't expect it to vary too much by chance.
Using uniquely mappable regions to improve results
To use the uniq-map information, specify the location of the unzipped directory on the command line with "-uniqmap <directory>":
GRO-Seq analysis output
Command line options for findPeaks
Usage: findPeaks <tag directory> [options]Finds peaks in the provided tag directory. By default, peak list printed to stdout
General analysis options:
-o <filename|auto> (file name for to output peaks, default: stdout)
"-o auto" will send output to "<tag directory>/peaks.txt", ".../regions.txt",
or ".../transcripts.txt" depending on the "-style" option
-style <option> (Specialized options for specific analysis strategies)
factor (transcription factor ChIP-Seq, uses -center, output: peaks.txt, default)
histone (histone modification ChIP-Seq, region based, uses -region -size 500 -L 0, regions.txt)
groseq (de novo transcript identification from GroSeq data, transcripts.txt)
tss (TSS identification from 5' RNA sequencing, tss.txt)
dnase (Hypersensitivity [crawford style (nicking)], peaks.txt)
super (Super Enhancers, superEnhancers.txt)
mC (Cytosine methylation (BS-seq/methylC-seq), regions.txt)
chipseq/histone options:
-i <input tag directory> (Experiment to use as IgG/Input/Control)
-size <#> (Peak size, default: auto)
-minDist <#> (minimum distance between peaks, default: peak size x2)
-gsize <#> (Set effective mappable genome size, default: 2e9)
-fragLength <#|auto> (Approximate fragment length, default: auto)
-inputFragLength <#|auto> (Approximate fragment length of input tags, default: auto)
-tbp <#> (Maximum tags per bp to count, 0 = no limit, default: auto)
-inputtbp <#> (Maximum tags per bp to count in input, 0 = no limit, default: auto)
-strand <both|separate> (find peaks using tags on both strands or separate, default:both)
-norm # (Tag count to normalize to, default 10000000)
-region (extends start/stop coordinates to cover full region considered "enriched")
-center (Centers peaks on maximum tag overlap and calculates focus ratios)
-nfr (Centers peaks on most likely nucleosome free region [works best with mnase data])
(-center and -nfr can be performed later with "getPeakTags"
Peak Filtering options: (set -F/-L/-C to 0 to skip)
-F <#> (fold enrichment over input tag count, default: 4.0)
-P <#> (poisson p-value threshold relative to input tag count, default: 0.0001)
-L <#> (fold enrichment over local tag count, default: 4.0)
-LP <#> (poisson p-value threshold relative to local tag count, default: 0.0001)
-C <#> (fold enrichment limit of expected unique tag positions, default: 2.0)
-localSize <#> (region to check for local tag enrichment, default: 10000)
-inputSize <#> (Size of region to search for control tags, default: 2x peak size)
-fdr <#> (False discovery rate, default = 0.001)
-poisson <#> (Set poisson p-value cutoff, default: uses fdr)
-tagThreshold <#> (Set # of tags to define a peak, default: 25)
-ntagThreshold <#> (Set # of normalized tags to define a peak, by default uses 1e7 for norm)
-minTagThreshold <#> (Absolute minimum tags per peak, default: expected tags per peak)
SuperEnhancer Options: (Need to specify "-style super"):
-superSlope <#> (Slope threshold to identify super vs. typical enh., default: 1.00)
-superWindow <#> (moving window/number of peaks to use to calculate slope, default: 10)
-typical <filename> (Output typical enhancers to this file, default: not used)
MethylC-Seq/BS-Seq options (Need to specify "-style mC"):
-unmethylC / -methylC (find unmethylated/methylated regions, default: -unmethyC)
-mCthresh <#> (methylation threshold of regions, default: avg methylation/2)
-minNumC <#> (Minimum number of cytosines per methylation peak, default: 6)
GroSeq Options (Need to specify "-style groseq"):
-tssSize <#> (size of region for initiation detection/artifact size, default: 250)
-minBodySize <#> (size of regoin for transcript body detection, default: 1000)
-tssFold <#> (fold enrichment for new initiation dectection, default: 4.0)
-bodyFold <#> (fold enrichment for new transcript dectection, default: 4.0)
-endFold <#> (end transcript when levels are this much less than the start, default: 10.0)
-method <fold|level> (method used for identifying new transcripts, default: fold)
-fragLength <#> (Approximate fragment length, default: 150)
-uniqmap <directory> (directory of binary files specifying uniquely mappable locations)
Download from http://biowhat.ucsd.edu/homer/groseq/
-confPvalue <#> (confidence p-value: 1.00e-05)
-minReadDepth <#> (Minimum initial read depth for transcripts, default: auto)
-pseudoCount <#> (Pseudo tag count, default: 2.0)
-rev (reverse strand of reads - for first-strand rna-seq/gro-seq)
-gtf <filename> (Output de novo transcripts in GTF format)
"-o auto" will produce <dir>/transcripts.txt and <dir>/transcripts.gtf
Links to alternative peak finding software
- MACS
(Liu Lab)
- ChIPSeq Peak Finder (Wold Lab)
- CCAT (Good for histone modifications)
- FindPeaks
- Probably hundreds of others: Google it!

Can't figure something out? Questions, comments, concerns, or other feedback:
cbenner@salk.edu