
HOMER
Software for motif discovery and ChIP-Seq analysis
Finding Overlapping and Differentially Bound Peaks
HOMER provides a utility for comparing sets of peaks called mergePeaks. It's default behavior is to take two or more peak files and return a single peak file containing the unique peak positions from the original files. For example:mergePeaks -d <maximum distance to merge>
<peak file1> <peak file2> [peak file3] ...
> newPeakFile.txt
The program will output a
new peak file containing the merged peaks to stdout. Peaks
within the distance in bp specified by "-d <#>" will be
reported as the average position between the peaks found
within the common region. The origin of the peaks is
specified in the 7th column of the new peak file.
Alternatively you can specify "-d given" to require a specific overlap
between the start and end coordinates of the peaks.
This is more useful if comparing large regions as opposed
to peaks. The program will also output the numbers
for creating a venn diagram, and these can be directed to
a specific file by specifying "-venn <filename>".
NOTE: As of v4.4, mergePeaks now
now looks for specific, literal overlaps by default (-d
given) and matches most users expectations.
Separating Peaks into Unique and Overlapping sets
Merging peaks together into
a single file is very useful for certain types of
analysis, such as making scatter plots that compare the
tag-densities between peaks from separate experiments - in
this case you want to count tags at specific and common
regions. Alternatively, you may be interested in
separating the peaks into common and specific sets for
focused analysis. To do this use the "-prefix <filename>"
option - this will create separate files based on
overlapping peaks for each set of peaks. For example:
mergePeaks -d 100 pu1.peaks cebp.peaks -prefix
mmm
This will create files named "mmm_pu1.peaks", "mmm_cebp.peaks", and "mmm_pu1.peaks_cebp.peaks".
The output file will contain the following columns:
1. Merged Peak name (will
start with "Merged-")
2. chromosome
3. start (average from merged peaks)
4. end (average from merged peaks)
5. strand
6. Average peak score (actually, the average of the original values in column 6 of the peak files - or column 5 of BED files)
7. Original peak files contributing to the merged peak
8. Total number of peaks merged (occasionally more than one peak from a single file will be merged if the peaks are within the specify distance or two or more peaks from one file overlap with the same single peak(s) from another file)
Peak Co-Occurrence Statistics
The mergePeaks program
will also find calculate the statistics of co-occurrence
between peaks in a pairwise fashion. If "-matrix <filename>"
is specified, HOMER will calculate statistics about the
pairwise overlap of peaks. Three separate pairwise
matrix files will be produced using the supplied
<filename> as a prefix:
filename.logPvalue.matrix.txt (natural
log p-values for overlap using the hypergeometric
distribution, positive values signify divergence)
filename.logRatio.matrix.txt (natural log of the ratio of observed overlapping peaks to the expected number of overlapping peaks)
filename.count.matrix.txt (raw counts of overlapping peaks)
The statistics are dependent on the effective size of the
genome, which can be specified using "-gsize <#>"
(default: 2,000,000,000)filename.logRatio.matrix.txt (natural log of the ratio of observed overlapping peaks to the expected number of overlapping peaks)
filename.count.matrix.txt (raw counts of overlapping peaks)
Co-Bound Peaks
Sometimes you just want to
know how many other peaks bind a set of reference
peaks. If "-cobound
<#>", mergePeaks counts how many of the
other peak files contain overlapping peaks with the peaks
found in the first peak file. It then outputs peak
files named "coboundBy0.txt", "coboundBy1.txt", etc. up to
the number specified.
Differentially Bound Peaks
To find peaks that are
differentially enriched between two experiments, there are
two basic options. First, you could run findPeaks (info here) using the 2nd
experiment as the control sample. Alternatively, you
can use getDifferentialPeaks,
which will take a given list of peaks and quickly identify
which peaks contain significantly more tags in the target
experiment relative to the background experiment. To
use it, follow this syntax:
By default it looks for peaks that have 4-fold more tags (sequencing-depth independent) and a cumulative Poisson p-value less than 0.0001 (sequencing-depth dependent). These parameters are adjustable with ("-F <#>", and "-P <#>"). By specifying "-same", peaks that are similar between the two tag directories will be returned instead of differential peaks. One caveat is that it is a good idea to set the size of the region used to search for reads to be larger than the actual peaks (i.e. +100 bp relative to the peak size) to avoid problems that arise from experiments with different fragment lengths, etc.
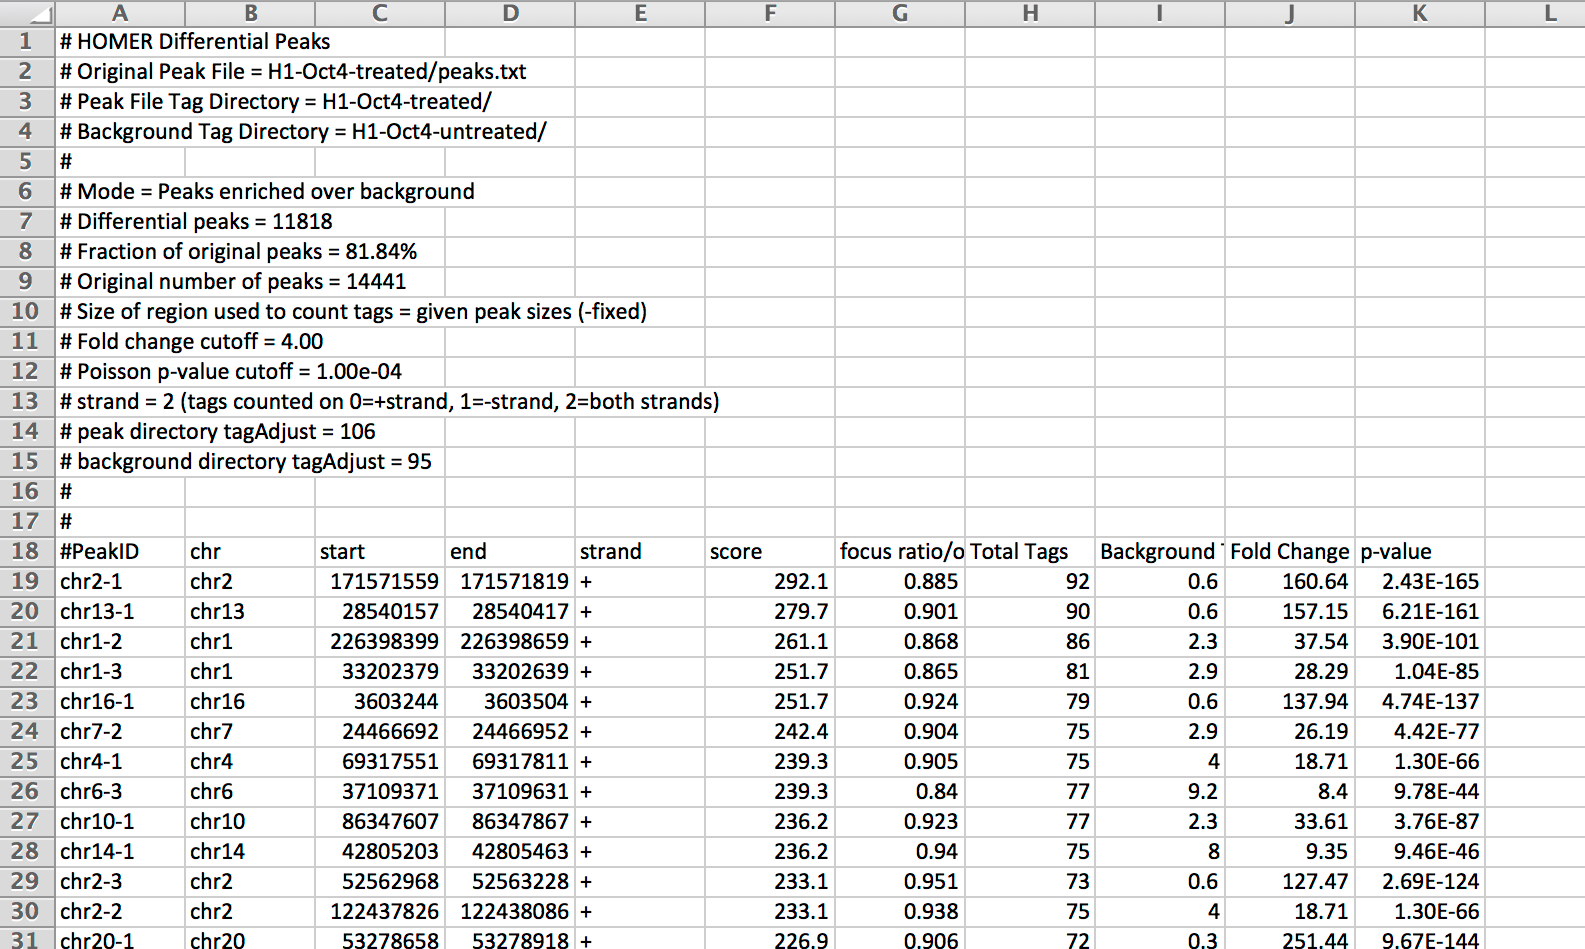
The output file for getDifferentialPeaks looks like the following:
getDifferentialPeaks <peak/BED file>
<target Tag directory> <background Tag
directory> [options]
By default it looks for peaks that have 4-fold more tags (sequencing-depth independent) and a cumulative Poisson p-value less than 0.0001 (sequencing-depth dependent). These parameters are adjustable with ("-F <#>", and "-P <#>"). By specifying "-same", peaks that are similar between the two tag directories will be returned instead of differential peaks. One caveat is that it is a good idea to set the size of the region used to search for reads to be larger than the actual peaks (i.e. +100 bp relative to the peak size) to avoid problems that arise from experiments with different fragment lengths, etc.
The output file for getDifferentialPeaks looks like the following:
Columns 8-11 contain information about the differential peak detection (colunns 1-7 come from the original peak file, including the 'score' and focus 'ratio/other' columns):
Column 8: Total [normalized] reads in the target tag directory
Column 9: Total [nomralized] reads in the background directory
Column 10: Fold change (Target/Background Total reads)
Column 11: Poisson-based p-value calculation for target read total assuming background read total represents the expected number of reads.
NOTE about normalization for this step: The read counts are normalized to the total number of reads found in their tag directories (no fancy normalization is assumed for this analysis). However, to be conservative with the Poisson calculations, the experiment with the largest number of reads is normalized such that it contains the same number of reads as the smaller experiment. As a result, only one of the directories - either the target directory ("Total Tags", column 8) or the background directory ("Background Tags", Column 9), will have integer counts and the other is likely to contain fractional counts.
Command Line options for mergePeaks
Usage: mergePeaks [options] <primary peak file> [additional peak/annotation files...]Merges and/or compares peak/position files (peak files listed twice are only considered once)
General Options:
-strand (Only merge/consider peaks on the same strand, default: either strand)
-d <#|given> (Maximum distance between peak centers to merge, default: 100)
Using "-d given" looks for literal overlaps in peak regions
Use "-d given" when features have vastly different sizes (i.e. peaks vs. introns)
-file <filename> (file listing peak files to compare - for lots of peak files)
-gsize <#> (Genome size for significance calculations, default: 2e9)
Merging Peaks Options (default):
-prefix <filename> (Generates separate files for overlapping and unique peaks)
By default all peaks are sent to stdout
-matrix <filename> (Generates files with pairwise comparison statistics)
filename.logPvalue.matrix.txt - ln p-values for overlap, +values for divergence
filename.logRatio.matrix.txt - ln ratio of observed/expected overlaps
filename.count.matrix.txt - peak overlap counts
-venn <filename> (output venn diagram numbers to file, default: to stderr)
-code (report peak membership as binary instead of by file names)
Classify peaks by how many are co-bound by other peak files vs. reference(1st file)
-cobound <#> (Maximum number of co-bound peaks to consider)
Will output sets of peaks that are co-bound by various numbers of factors
to files coBoundBy0.txt, coBoundBy1.txt, coboundBy2.txt, ...
Or <prefix>.coBoundBy0.txt, <prefix>.coBoundBy1.txt, ...
-matrix <filename> (generates similar files to above with pairwise overlap statistics)
Single peak file:
(If a single peak file is given, peaks within the maximum distance will be merged)
-filter chrN:XXX-YYY (only analyze peaks within range)
-coverage <output file> (returns the total bp covered by each peak file - use "-d given"
Command Line options for getDifferentialPeaks
Usage: getDifferentialPeaks <peak file> <target tag directory> <background tag directory> [options]Extracts tags near each peak from the tag directories and counts them,
outputting peaks with significantly different tag densities
General Options:
-F <#> (fold enrichment over background tag count, default: 4.0)
-P <#> (poisson enrichment p-value over background tag count, default: 0.0001)
-same (return similar peaks instead of different peaks)
-rev (return peaks with higher tag counts in background instead of target library)
-size <#> (size of region around peak to count tags, default: -fixed)
-fixed (Count tags relative to actual peak start and stop, default)
"-size given" is the same as "-fixed"
Advanced Options:
-strand <both|+|-> (Strand [relative to peak] to count tags from, default:both)
-tagAdjust <#> (bp to shift tag positions to estimate fragment centers, default: auto)
'-tagAdjust auto' uses half of the estimated tag fragment length
-tagAdjustBg <#> (bp to shift background tag positions to estimate fragment centers, default: auto)
'-tagAdjustBg auto' uses half of the estimated tag fragment length
-tbp <#> (Maximum tags per bp to count, 0 = no limit, default: 0)
-tbpBg <#> (Maximum background tags per bp to count, 0 = no limit, default: 0)

Can't figure something out? Questions, comments, concerns, or other feedback:
cbenner@salk.edu