
HOMER
Software for motif discovery and next-gen sequencing analysis
Quantifying RNA expression in Genes and Repeat regions
HOMER contains two specialized programs to quantify RNA
reads in the genome (analyzeRNA.pl and analyzeRepeats.pl).
The goal of these tools is to make certain types of
RNA-Seq/GRO-Seq analysis easy and straightforward.
They are relatively simple - the idea is to count reads in
regions - not perform complex probabilistic inference of
true gene expression values (such as with cufflinks and some
other tools). The problem with some complex methods is
that the assumptions driving them may not always be valid in
all situations, and I've found I often run into more
problems than solutions with some of these software packages
(that's not to say there aren't good tools out there!).analyzeRNA.pl and analyzeRepeats.pl primarily produce a gene expression matrix from "Tag Directories", and work in a similar manner to how annotatedPeaks.pl works for ChIP-Seq data. There options to count reads in "genic" vs. "exon" regions, normalization options, and other features. Both programs work in a very similar manner and most options are interchangeable between the two [Both analyze mRNA or repeats even though their names are different!!]. Generally speaking, at some point in the future everything will be available in analyzeRepeats.pl. Once a gene expression matrix is generated, it can be treated a lot like microarray data and a series of other analysis techniques can be applied to the data. HOMER also provides a script to integrate with popular R/Bioconductor differential expression callers (getDiffExpression.pl).
On that note, analyzeRNA.pl and analyzeRepeats.pl DO NOT produce differential expression or differential splicing calls. It would be great if Chuck had the time to help me with that, but for now I recommend sending the output from analyzeRNA.pl to other utilities such as edgeR or DESeq or whatever your favorite next-gen differential signal finder is. getDiffExpression.pl is provided as a tool to help automate the process of using EdgeR or DESeq.
analyzeRNA.pl vs. analyzeRepeats.pl
Of all the tools in HOMER, analyzeRNA.pl is probably the least efficient and resource hungry program in terms of memory. It needs to be rewritten, and more and more of it's functionality is being ported to analyzeRepeats.pl (which is much more efficient). Nearly all of its functions are replicated in analyzeRepeats.pl or in other programs.
Use analyzeRNA.pl when:
[Recommended] Use analyzeRepeats.pl when:
- Never
Calculating Pausing Ratios with GRO-Seq data
- Quantifying Gene Expression of exonic regions or whole gene bodies from RNA-Seq, GRO-Seq, etc.
- Quantifying the expression of Repeat regions
- Quantifying Pausing Ratios for GRO-Seq
Basic usage (same for analyzeRNA.pl and analyzeRepeats.pl):
i.e. analyzeRepeats.pl rna hg19 -count genes -d IMR90-GroSeq > outputfile.txt
Specifying the Genes/Transcripts to Analyze
- rna - This will direct HOMER to analyze the default RefSeq annotation for that genome.
- repeats -
HOMER will load repeat definitions from UCSC and
assess the expression levels of different repeat
classes. It is recommended to only use this
option with analyzeRepeats.pl.
- <GTF file> - Specify your own custom genes. These can an alternative annotation (i.e. Ensembl genes, UCSC genes) or it can be custom, de novo genes you found analyzing GRO-Seq or mRNAs defined using "cufflinks". If you are looking for a GTF file for you favorite annotation, check out the UCSC Table Browser. You can use this tool to download GTF formmated files (with the correct genome version) for many popular annotations.
- <peak/homer transcript file> - Specify
you own regions using a peak file.
Choosing Experiments to Analyze
analyzeRepeats.pl rna hg19 -d LNCaP-RNA-Seq-notx/ LNCaP-RNA-Seq-Dht/ > outputfile.txt
This will produce an output file containing genes expression values for two experiments, "LNCaP-RNA-Seq-notx" and "LNCaP-RNA-Seq-Dht".
Measuring Gene Expression in Exons vs. Gene Bodies.
- exons - Counts tags in exons only. Use this for most applications of RNA-Seq, such as polyA-RNA-seq or other techniques that aim to measure mRNA.
- cds - Counts tags in coding regions only. This could be useful for quantifying ribosome coverage on coding sequences with techniques such as Ribo-Seq
- introns - Counts tags on introns only.
- 5utr or 3utr - Count tags
on 5' UTR and 3' UTR regions, respectively.
- genes (default)
- Counts tags on the full gene body (TSS to
TTS). This is useful for GRO-Seq where we expect
coverage across the entire transcript. Can also
be used to quantify H3K36me3 or PolII ChIP-Seq.
"-strand -" - only measure - strand (relative to gene orientation), for strand specific RNA from dUTP style protocols (TruSeq kits, etc.)
"-strand both" - default as of v4.7, count reads on both strands, for non-strand specific RNA or ChIP-Seq
HOMER counts reads by considering their 5' position. It will also assign reads to each transcript they are found within.
analyzeRNA.pl specific features
There are a couple options to slightly modify how tags are counted to avoid TSS/TTS features. By specifying "-start <#>", you can adjust where (relative to the TSS) HOMER starts counting reads. This is useful for GRO-Seq when you might want to avoid the promoter-proximal paused region by add "-start 500" to start counting 500 bp downstream from the TSS. Negative values would start counting 500 bp upstream. The optoin "-end <#>" is similar, but applies to the TTS. Negative values will stop the tag counting upstream of the TTS ("-end -500"), while positive values will count tags further downstream.
Normalization of Gene Expression Values
By default, HOMER normalizes each experiment to 10 million mapped reads, which is the same normalization strategy used in annotatePeaks.pl for ChIP-Seq data. However, RNA has the potential to contain much more "contaminates" than ChIP-Seq. In ChIP-Seq, the background is the genome, with random fragments coming down in the immunoprecipitation step. With RNA, instead of a two copies of the genome per cell, you have 95%+ ribosomal RNA, along with a host of other very very common short RNA species such as tRNAs, snoRNAs, and other problematic things, and then a small fraction of what you're actually interested in. Most RNA-Seq protocols contain enrichment steps, such as polyA selection, to isolate mRNAs from the rest of the crap (my apologies to those studying rRNA and tRNA). These enrichment steps can have different efficiencies from sample to sample, with some samples containing more rRNA, tRNA etc. than others. When mapping to the genome, many of these RNA species will be discarded if you only keep reads that map uniquely since the genomic elements that create them are often repeated in the genome. However, you're bound to still map many of these reads. Differential contamination of common RNA species can throw off the default normalization - if 50% of your "mapped" reads are rRNA in one sample and only 25% in another, you're likely going to have problems.
There are several things you can do to combat these problems. One is to "pre-clear" common RNA species computationally, i.e. map your reads to rRNA first to remove them, then map the rest to the genome. Another strategy is to normalize strictly with mRNA species only instead of considering the total number of mapped reads. In general, I would recommend normalizing in this strategy ("-normMatrix <#>") - it's probably the safest in most situations due to the contamination problem. Below are the various normalization options in analyzeRepeats.pl and analyzeRNA.pl.
- [default] -norm <#> - Normalize the total number of mapped reads per experiment to #, this is the default "-norm 1e7".
- -normMatrix <#> - Normalize the total of number of reads found in the gene expression matrix to # (i.e. normalize total reads in mRNAs)
- -raw or -noadj - Don't perform any normalization, just report the exact number of reads found. This is useful when sending the output of HOMER to another differential expression program such as edgeR or similar that requires the raw read counts. (paired end reads reported as half counts)
- -raw - same as -noadj, reports total
counts
- -quantile - [analyzeRepeats.pl only]
perform quantile normalization (might be the best
option in some cases)
- -rpkm -
Report normalized values as reads per kilobase per
million mapped reads
- -log - Report log normalized values with jitter =log2(x+1+rand(0-1))
- -sqrt - Report square root of the normalized value with jitter =sqrt(x+rand(0-1))
Instead of the above basic normalization/transformations, HOMER can automate the calculation of rlog or vst transformations from R/DESeq2. This requires R and DESeq2 to be installed (see here). These transformations equalize the variance across intensity ranges, making them ideal for downstream analysis with clustering/PCA analysis. Unfortunately, these transforms require at least 3 samples to work.
- -rlog (Use DESeq2's rlog transform - creates better behaved data)
- -vst (Use DESeq2's VST transform - better for large numbers of samples)
Limiting the number of
Tags per Position ("-pc <#>")
analyzeRepeats.pl specific options and output
analyzeRepeats.pl leverages more of HOMER's C++ base to make read counting and processing much faster. This also enables repeats to be efficiently quantified across the genome.
Gene Expression Options and Output
analyzeRepeats.pl also has some useful features with respect to gene annotations that help control how the information is outputted when using 'rna' or your own GTF file:
The output file will contain the following information (by column):
- -condenseGenes (only reports one isoform per locus - based on Entrez Gene ID)
- -noCondensing (do NOT combine expression information if the same transcript ID is represented twice. Lets say a gene shows up in two locations in the genome. Normally HOMER will add their expression information together. Specifying this option will separate their expression information)
- -noCondensingParts (report expression of each 'fragment' of a transcript i.e. exons reported separately. Normally each feature is counted separately and added together - this will report each part separately).
- Transcript ID (RefSeq if 'rna' is used)
- Chromosome
- Start
- End
- Strand
- RNA length
- copies of transcript annotation in the genome
- annotation information
- Data: First Tag Directory Gene Expression information
- [Data: Second Tag Directory Gene Expression information]
- ...
If you want additional information, consider running the command addGeneAnnotation.pl to beef up the annotation output:
addGeneAnnotation.pl <data file> <organism> [header: yes|no]
i.e. addGeneAnnotation.pl output.txt human yes > output.ann.txt
Analyzing Repeat and non-mRNA Expression
mRNA is not the only RNA species present in the cell. In fact, it makes up a very small fraction of the total. analyzeRepeats.pl offers an option to help quantify repeat RNAs, rRNA, etc. By specifying "repeats", HOMER will load the definition of all repeats in the genome and quantify tags on them. Within the repeat definition are tRNAs, rRNAs, etc. so you get more than just transposable elements. Use it like this:
analyzeRNA.pl repeats mm9 -d Macrophage-RNAseq > outputfile.txt
By default, all the repeats are treated like "exons". Repeats from similar classes are combined to give a single expression value.
To do repeat expression justice, you should carefully consider how the data is mapped to the genome. Normally for ChIP-Seq (or even RNA-Seq), you do not want to consider reads that map to multiple locations in the genome. However, in the case of RNA repeats, this means that you will be discarding many of the reads mapping to repeat regions. One trick that works fairly well is to keep one random position from the mapping, regardless if it maps uniquely to the genome (but only do it for this type of analysis). Typically, if a read maps to multiple locations, those multiple locations are probably all the same type of repeat element, so it will be added to the expression of that repeat class regardless of where it is specifically placed. HOMER will keep one read (the primary alignment) if you add the "-keepOne" command when creating Tag Directories. This is "approximate", so use with care. For example, when making tag directories:
makeTagDirectory Macrophage-RNAseq alignment.sam -keepOneThe thing to note is that repeat/rRNA/tRNA expression is compounded by the fact that most protocols try to get rid of it, so depending on the efficiency of these clearing steps experiment-to-experiment, you may be measuring the difference in clearing efficiency rather than the actual expression of the RNA.
Output Format (stdout):
* Since most repeats are found in hundreds or thousands of locations, only the repeat with the highest individual read density is reported.
- Repeat ID (name | family | class)
- * Chromosome
- * Start
- * End
- * Strand
- Average repeat length
- copies of repeat in the genome
- Average divergence of repeat from repbase model
- Data: First Tag Directory Gene Expression information
- [Data: Second Tag Directory Gene Expression information]
- ...
Controlling how repeats are reported
Since there are millions of repeat elements annotated in the mouse or human genomes, it is important to be able to control how they are processed and their gene expression information reported.
Only analyze repeats from a specific name, family, or class (you can look these up by clicking on repeats in the genome browser). For example, by specifying "-L2 LINE", only LINE elements will be analyzed. Similarly, "-L3 L1" will restrict analysis to LINE L1 elements.
-L1 <name> (Specific repeat names, such as L1HS, AluSx, etc.)
-L2 <family> (top level, SINE, LINE, LTR, DNA, RNA, Satellite, Low_complexity, Simple_repeat)
-L3 <class> (2nd level, such as L1, L2, Alu, etc.)
(default: report all repeats)
Normally, repeat expression is condensed such that all reads found in a given repeat name (i.e. -condenseL1) are reported as a single element. You can also report reads condensed down to each class or family. Alternatively, you can report each instance of a repeat separately (-noCondensing) - however, if you do this, it is recommended you filter your repeats with one of the options above to avoid outputting millions of different repeat elements:
-noCondensing (report each repeat element separately)You may also find yourself only interested in repeat elements that have minimal divergence from their consensus repbase element. The idea is that the less divergence, the more likely that they are the result of recent insertion event. Divergence in this case is measured as the fraction of mutations relative to the original repeat element (0-100%). You may also want to limit your analysis to repeats that are full length. The following options allow you to control which repeats are used in the analysis:
-condenseL1 (default, condense reads from each repeat name into one entry)
-condenseL2 (condense reads from each family into a single entry)
-condenseL3 (condense reads from each class into a single entry)
-maxdiv <#> (Maximum repeat divergence to consider 0-1.00, default, no maximum)
-mindiv <#> (Minimum repeat divergense to consider, range 0-1.00, default no minimum)
-maxLength <#> (Maximum length of repeat to consider in bp, default no maximum)
-minLength <#> (Minimum length of repeat to consider in bp, default no minimum)
-maxLengthP <#> (Maximum length of repeat to consider as % of full length, range 0-1.00, default no maximum)
-minLengthP <#> (Minimum length of repeat to consideras % of full length, range 0-1.00, default no minimum)
-noexon (Do not consider repeats in exons - useful to avoid counting mRNA reads as repeat reads...)
Checking for transcript read-through
One of the biggest challenges of quantifying expression of repeats is that often the reads are not from the repeat but instead represent signal from a transcript that transcribes 'through' the repeat, such as a SINE repeat in the 3' UTR of a protein coding gene. To help identify instances where this may be a problem, analyzeRepeats.pl will quantify the reads immediate upstream or downstream of repeats if you specify "-upstream <#>" or "-downstream <#>". You can then specify "-L <#>" to filter repeats that do not have a read enrichment of at least # relative to the upstream and downstream regions.
Reporting Repeat Coordinates
Lets say that for some reason you want to get the coordinates of all Alu elements - maybe you want to make a histogram of read density using annotatePeaks.pl! If you do not specify any tag directories (-d "<tag dir>") with analyzeRepeats.pl, the command will simply output a list of positions instead of calculating expression information. For example, the following will output all Alu elements:
analyzeRepeats.pl repeats hg19 -L3 Alu > output.txtUseful parameters for this type of output are the following:
-og (report coordinate based on full length repeat element - many elements are truncated insertions, this will line them up at a common reference point)
-5p (report coordinates centered on 5' end of repeat, useful when combined with -og)
-3p (report coordinates centered on 3' end of repeat, useful when combined with -og)
analyzeRNA.pl specific options and output
- Parses the RNA definition file to figure out where all of the genes are in the genome.
- Queries each of the "Tag Directories" and determine where each of the tags are within gene bodies.
- At that point it will rummage through the tag positions and count only the tags found within the desired regions (i.e. exons). Incidently, this is also the part that makes it less efficient at the momment - it's done with perl and keeps way too much extra information around.
- Expression values are calculated and normalized
- Results are formatted and set to stdout
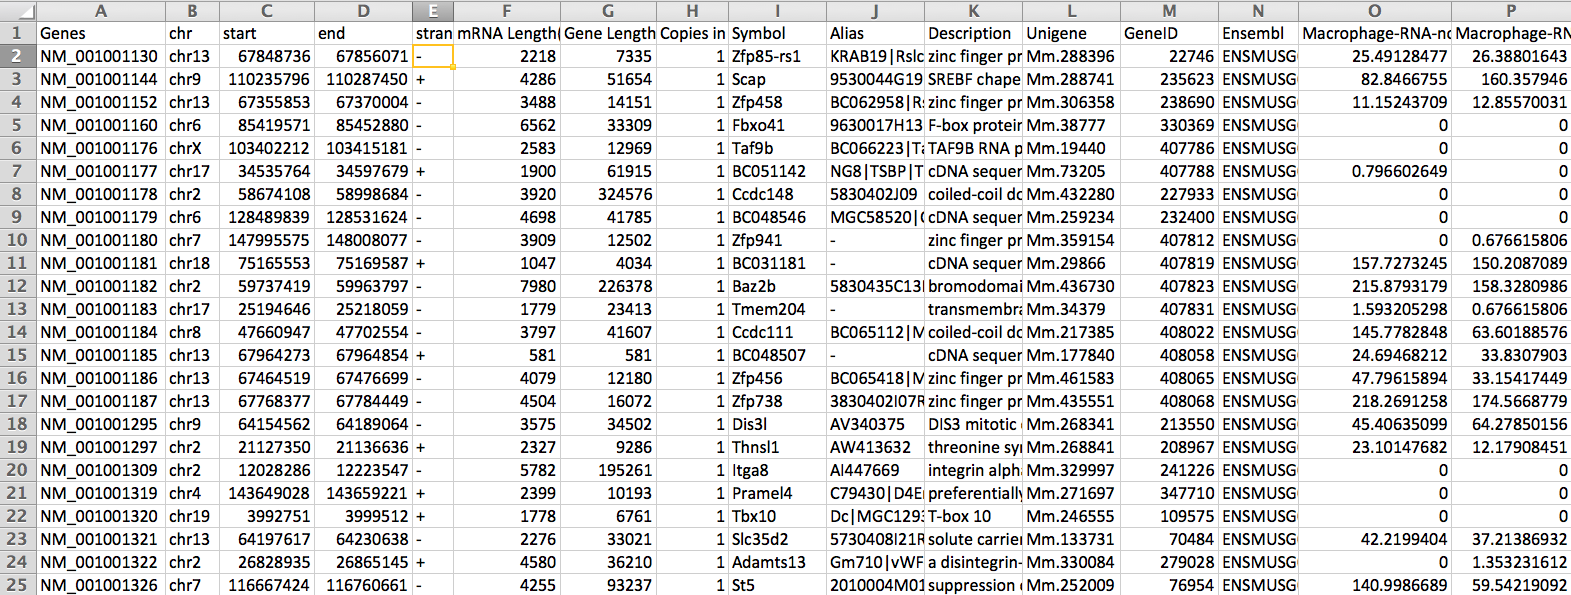
The output gene expression matrix with the following columns:
A separate column is generated for each tag directory. The head of these columns contains the name, the region of the gene used for expression (i.e. gene, exon, 5utr..), the total number of mapped tags in the directory, and the normalization factor.
- Transcript ID (RefSeq accession is the default with "rna" option, custom name is used otherwise)
- chromosome
- start
- end
- strand
- mRNA length (e.g. exons only)
- gene length (TSS to TTS)
- Copies in genome (some genes map to the genome more than once...)
- Symbol (e.g Gene Name)
- Alias (alternative gene names)
- Description
- Unigene
- Entrez Gene ID
- Ensembl
- Data: First Tag Directory Gene Expression information
- [Data: Second Tag Directory Gene Expression information]
- ...
Due to the fact that some genes map to multiple places in the genome (<1% of RefSeq), only one of their locations will be reported. However, the gene length and mRNA lengths will be averaged, and their read totals will be averaged in the output.
If custom IDs are used, HOMER will attempt to link them to known gene identifiers (As of now it does not annotate their position, just treats their ID as an accession number and tries to match it wil known genes). If you give analyzeRNA.pl a custom GTF file from Cufflinks, where the IDs are all "CUFF12345.1", most of the annotation columns will be blank.
Below is an example of the output opened with EXCEL:
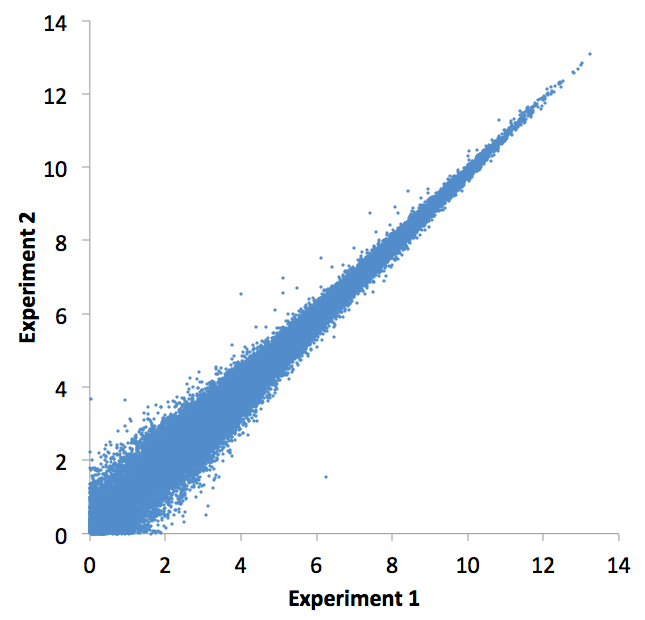
If you specify the "-log" or "-sqrt" options, you can make a nice X-Y scatter plot of the data columns. Here is an example:
Quantifying Promoter-proximal RNA Polymerase Pausing
One of the neat observations from GRO-Seq experiments is that an actively engadged RNA Polymerases are present at the promoters of many genes, but they do not seem to elongate down the body of the gene. The idea is that they are "paused", waiting for elongation signals to give them the green light to make the gene.
HOMER can calculate the "pausing" ratio, which is the ratio of tag density at the promoter relative to the body of the gene. To do this with analyzeRepeats.pl, specify the "-count pausing" option. This will quantify the read density at the TSS (-50-200bp) and calculate the ratio relative to the gene body read density (200-5kb). This will queue the program to produce 3 columns of output per experiment. First, it will report the pausing ratio, and then it will report the promoter and gene body read densities. You can also control the way the ratio is calculated such as defining where the promoter and gene body regions start and end:
-count pausing - required for pausing analysis
-pPromoterStart <#> - start of promoter region relative to TSS, default: -50
-pPromoterEnd <#> - end of promoter region relative to TSS, default: 200
-pBodyStart <#> - start of gene body region relative to TSS, default: 200
-pBodyEnd <#> - end of gene body region relative to TSS, default: 5000
-pPsuedoRatio <#> - Reads per bp [pseudo count] for ratio calculation, default: 0.005
NOTE: To quantify pausing with analyzeRNA.pl, specify "-pausing <#>", where # the is the distance downstream of the TSS to stop counting promoter tags and start counting gene body tags. 200 is the recommended value, but it is advised that you use analyzeRepeats.pl instead.

Finding Differentially Regulated Genes
As of now, HOMER doesn't have routines for calculating differential gene expression. However, it does help support analysis with edgeR and DESeq/DESeq2, two R/Bioconductor packages designed for RNA-Seq differential expression analysis. HOMER contains a script called getDiffExpression.pl to help automate the steps of running edgeR/DESeq and formatting the results.
For more information on finding differentially regulated genes, visit the getDiffExpression.pl page.
Other Analysis Ideas
Once your data is in a gene expression matrix, there are countless ways to analyze your data. Check out this link for more ideas.
Command line options for analyzeRepeats.pl
Usage:
analyzeRepeats.pl <input file> <genome>
[options] ...
Where <input
file> can be one of:
rna (quantify gene expression of RefSeq annotated genes)
repeats (just type "repeats" to load the default repeats
for genome)
<gtf file> (quantify gene expression from GTF file)
<transcript file> (Homer formatted peak/transcript
file i.e. hg19.repeats)
Available
Genomes (required argument): (name,org,directory,default
promoter set)
Specifying
distinct classes of repeats or filtering based on
parameters:
-L1 <repeat name> (level one 'repeat name', i.e.
AluSx3)
-L2 <repeat name> (level two 'repeat family', i.e.
SINE)
-L3 <repeat name> (level three 'repeat class', i.e.
Alu)
-maxdiv (max divergence, i.e. -div 0.10, default: 1.0)
-mindiv (min divergence, default: 0)
-minLength <#> (only return repeats at lest this
length, default: 0)
-maxLength <#> (only return repeats less than % of
full length, default: no max)
-minLengthP <#> (only return repeats at lest % of
full length, default: 0%)
-maxLengthP <#> (only return repeats less than % of
full length, default: 100%)
-noexon (do not consider repeats found within coding
exons)
-condenseL2, -condenseL3 (combine read counts for repeats
for same L2 or L3 annotation)
-rmsk (force filtering of repeats in case it thinks your
file is for RNA)
Adjusting
coordinates returned:
-5p (return peak files centered on 5' end of repeats)
-3p (return peak files centered on 3' end of repeats)
-og (return positions relative to full length repeats)
GTF file
options if specifying a GTF file:
-gff/-gff3 (for GFF or GFF3 formated files - ideally use a
GTF formated file, default)
-gid (use gene_id instead of transcript_id when parsing
GTF file)
Expression/Read
Coverage Reporting Options:
-d <tag directory 1> [tag directory 2] ... (list of
experiment directories to show
tag counts for) NOTE: -dfile <file> where file is a
list of directories in first column
-count <genes|exons|introns|5utr|3utr|cds|pausing>
(regions to count reads in, default: genes)
Specify "-pausingOptions" to get more options for pausing
analysis for GRO-Seq data
-strand <+|-|both> (count tags on indicated strand,
default: both)
-pc <#> or -tbp <#> (maximum tags to count per
position, default: 0=no limit)
-log (output tag counts as randomized log2 values - for
scatter plots)
-sqrt (output tag counts as randomized sqrt values - for
scatter plots)
-condenseGenes (Only report one transcript from each gene
locus with highest expression)
-noCondensing (do not condense counts from entries will
same ID, default: do condense)
-noCondensingParts (i.e. report exons separately)
-min <#> (minimum expression value to print,
default: none)
Normalization:
-rpkm/-fpkm (Report results as fragments per kb per
million mapped)
-norm <#> (Normalize to total mapped tags: default
1e7)
-normMatrix <#> (Normalize to total tags in gene
expression matrix: not used)
-noadj (Don't normalize, -raw works too)
Advanced Normalization: (will adjust normalization from
above)
-quantile (quantile normalization on reported genes)
Checking
read-through expression: (example: "-upstream -1000 -L 2")
-upstream <#> (Distance upstream of each repeat to
check for reads, default: 0 [off])
-downstream <#> (Distance downstream to each repeat
to check for reads, default: 0 [off])
-L <#> (Only keep repeats with local enrichment
greater than #, default: keep all)
Pausing
Options (use with "-count pausing"):
-pPromoterStart <#> (start of promoter region
relative to TSS, default: -50)
-pPromoterEnd <#> (end of promoter region relative
to TSS, default: 200)
-pBodyStart <#> (start of gene body region relative
to TSS, default: 200)
-pBodyEnd <#> (end of gene body region relative to
TSS, default: 5000)
-pPsuedoRatio <#> (Reads per bp [pseudo count] for
ratio calculation, default: 0.005)
Annotation:
-gwasCatalog <gwasCatalog.txt> (Find overlapping
GWAS Catalog file from UCSC)
Command line options for analyzeRNA.pl
*** For standard
analysis of rna or repeats, analyzeRepeats.pl is faster and
recommendedUsage: analyzeRNA.pl <rna | repeats> <genome version> [additional options...]
-or-: analyzeRNA.pl <custom RNA/GTF file> <organism|none> [additional options...]
Program for quantifying RNA tag counts. The first argument can be "rna" (refseq genes),
"repeats" (repeat classes), or a custom RNA definition file (GTF format).
Available Genomes (required argument): (name,org,directory,default promoter set)
Primary Annotation Options:
-d <tag directory 1> [tag directory 2] ... (list of experiment directories to show
tag counts for) NOTE: -dfile <file> where file is a list of directories in first column
-rpkm (Report results as reads per kb per million mapped)
-norm <#> (Normalize to total mapped tags: default 1e7)
-normMatrix <#> (Normalize to total tags in gene expression matrix: not used)
-noadj (Don't normalize, -raw works too)
-count <exons|introns|genes|5utr|3utr|cds> (Count tags in introns, exons, etc., default: genes)
-noCondensing (do not condense counts from entries will same ID, default: do condense)
-pc <#> (maximum tags to count per position, default: 0=no limit)
-strand <+|-|both> (count tags on indicated strand, default: +)
-gene <data file> ... (Adds additional data to result based on the closest gene.
This is useful for adding gene expression data. The file must have a header,
and the first column must be a GeneID, Accession number, etc. If the peak
cannot be mapped to data in the file then the entry will be left empty.
-log (output tag counts as randomized log2 values - for scatter plots)
-sqrt (output tag counts as randomized sqrt values - for scatter plots)
-tss (estimate actual TSS in 1st exon and report as the centered position in columns 3 & 4)
-start <#> (start counting tags relative # offset of beginning of gene)
-end <#> (finish counting tags relative # offset to end of the gene)
-maxLength <#> (Don't count tags past # bp from the TSS, useful for GroSeq)
-pausing <#> (calculate ratio of pausing first [# bp of transcript] to gene body)
Produces 3 columns - promoter rpk, body rpk, and ratio (add -log for log versions)
Also sets "-count genes". Use "-strand both" when analyzing Pol II ChIP-Seq
rpk is reads per kb - set -norm 1e6 or -normMatrix 1e6 to get rpkm

Can't figure something out? Questions, comments, concerns, or other feedback:
cbenner@ucsd.edu