
HOMER
Software for motif discovery and next-gen sequencing analysis
Analyzing Chromatin Compaction with HOMER
Newer versions of HOMER's Hi-C analysis include methods to
analyze the relative compaction of chromatin, generally
describing how strong DNA interacts with DNA on distal
regions of the same chromosome or across other chromosomes.
The reason to consider compaction is that it appears to be
reasonably correlated with transcription activity, and
likely links the activity of transcription with changes in
chromatin structure. HOMER offers two simple measures
of chromatin compaction for a locus (DLR/ICF). In addition,
a description of how to create Hi-C interaction frequency
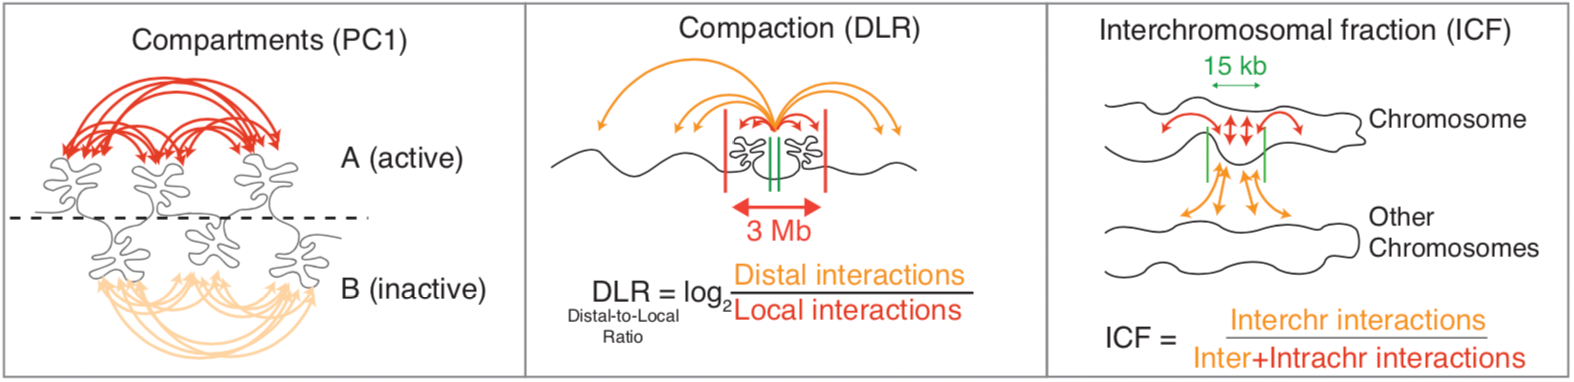
vs. distance plots for specific regions is found below:DLR (Distal-to-Local [log2] Ratio) - Log2 ratio of distal Hi-C interactions interacting along the chromosome at distances greater than 3 Mb compared to local Hi-C interactions interacting less than 3 Mb. This measure seems to correlate well with the presence of cohesin, a ring-like complex that is instrumental in looping chromatin.
ICF (Interchromosomal Fraction of Interactions) - Ratio of interchromosomal interactions relative to the total number of interactions at a locus. This measure seems to correlate well with transcription levels.
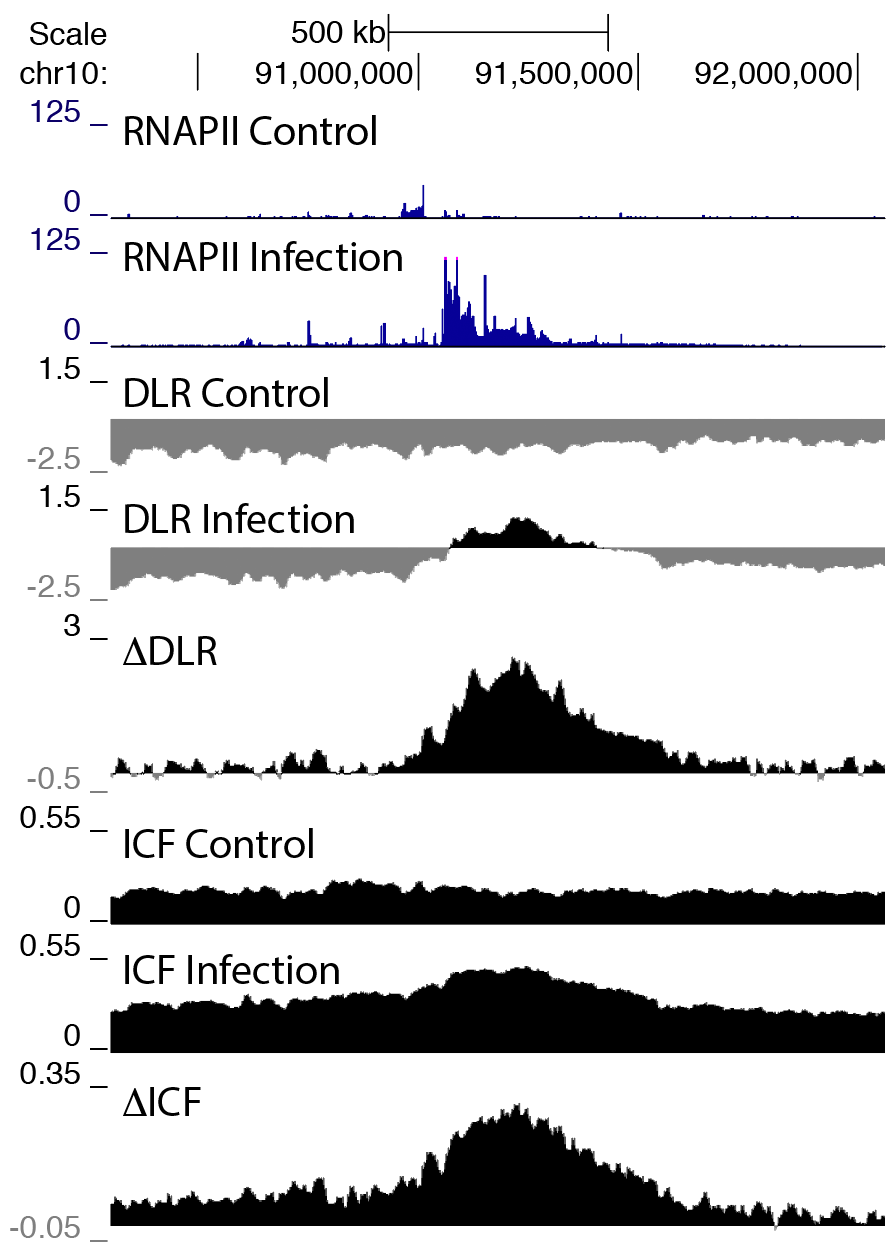
For both of these measures, their absolute values can vary a lot along the genome due to the presence of various features, like CTCF sites or other regulatory regions, being near the edges of chromosomes or near centromeres, etc. However, their difference between experiments tends to correlate well with changes in transcription, particularly for large genes/transcription units. Below is an example showing how large differences in transcription (measured by a large change in RNA polymerase II levels) is associated with large changes in DLR and ICF:
It is important to note that not all changes in transcription are necessarily associated with strong changes in compaction (DLR and/or ICF) - it does seem to be more dramatic if a higher percentage of cells are responding, and the longer the transcription unit, generally the greater the change in compaction.
Quick Reference
#calculate the distal-to-local log2 ratio (DLR) and interchromosomal fraction of interactions for each 5kb region of the genome (pooling interactions from a 15kb window size):
analyzeHiC HicExp1TagDir/ -res 5000 -window 15000 -nomatrix -compactionStats auto -cpu 10
#This will produce both *.DLR.bedGraph and *.ICF.bedGraph files and place them in the tag directory.
#Both the DLR and ICF are more useful for comparing experiments:
subtractBedGraphs.pl exp1.DLR.bedGraph exp2.DLR.bedGraph -center -name Exp1VsExp2-DLR > output.DLR.bedGraph
subtractBedGraphs.pl exp1.ICF.bedGraph exp2.ICF.bedGraph -center -name Exp1VsExp2-ICF > output.ICF.bedGraph
Calculating Compaction Scores with HOMER
analyzeHiC is the primary program used to generate DLR and ICF scores from Hi-C data. The main parameters to consider are the resolution/window size used for the calculation. You can also change the distance threshold used to determine "distal" vs. "local" interactions for the DLR calculation ("-dlrDistance"). By default this distance threshold is 3000000, which roughly corresponds to the transition between what we might think of as cohesin/TAD mediated interactions versus transcription/compartment mediated interactions. In general, the exact distance threshold used doesn't tend to make a huge difference with respect to changes in DLR, but in some cases this could be an important consideration.
The command to calculate the DLR/ICF is executed as follows:
analyzeHiC <HiC tag directory> -res <#> -window <#> -nomatrix -compactionStats <outputPrefix> -cpu <#> -dlrDistance 3000000
analyzeHiC HicExp1TagDir/ -res 5000 -window 15000 -nomatrix -compactionStats auto -cpu 10This command will produce 3 bedGraph files containing the DLR, ICF, and a control bedGraph containing coverage calculations (*.COV.bedGraph) which can be used to help exclude regions. If 'auto' is specified after the -compactionStats option, the bedGraph files will be placed inside the tag directory.
Differential Compaction
While the DLR and ICF are useful measures, their difference between conditions can be more useful to describe changes in genome structure, particularly with respect to changes in transcription. HOMER has two related scripts to help calculate differences in these two measures. The first, subtractBedGraphs.pl, will perform differential calculations on two bedGraphs to generate a 'difference bedGraph', and the 2nd, subtractBedGraphDirectory.pl, will automate the subtraction of compaction and PC1 scores between two experiments.
One important option is the "-center" option, which I would generally recommend using. The center argument will recenter the bedGraph such that the genome-wide difference between the two experiments is equal to zero. Generally this is useful to remove any technical differences that may have arisen between the experiments. For example, if one Hi-C experiment has 2% more interchromosomal interactions than the other, which could easily arise for technical reasons during the protocol, then the ICF difference may have a consistent offset of ~2% across the genome. Using "-center" will remove this constant difference, but still preserve locus-specific changes in ICF values.
Comparing two bedGraphs
subtractBedGraphs.pl <bedgraph 1> <bedgraph 2> -cov <coverage bedGraph> -name <track name> -center
subtractBedGraphs.pl exp1.ICF.bedGraph exp2.ICF.bedGraph -cov exp1.COV.bedGraph -name Exp1VsExp2 -center > output.bedGraph
This command will generate a new bedGraph file representing the difference between the two input bedGraphs (2nd file minus the first file). If a coverage file is provided (can be from either experiment), only regions with a read coverage greater than 15% of the average will be reported (to exclude noisy areas based on low read coverage). This threshold can be changed by using the "-covThresh <#>" option.
Comparing ICF, DLR, and PC1 bedGraphs between two Hi-C experiments
If the DLR/ICF calculation was performed using "-compactionStats auto", the DLR and ICF bedGraph files will be placed inside the Hi-C tag directory. In this case, you can use the following command to generate differential bedGraph files for each measure (including PC1.bedGraph files if you performed the runHiCpca.pl command using "auto" as the first argument as well) in batch.
subtractBedGraphsDirectory.pl <HiCTagDir1> <HiCTagDir2> -center -prefix <filename prefix>
subtractBedGraphsDirectory.pl Exp1HiCTagDir/ Exp2HiCTagDir/ -center -prefix Exp1VsExp2
This will create several bedGraph files starting with "Exp1VsExp2" that can then be uploaded to the genome browser or analyzed using annotatePeaks.pl or other programs.
Creating Hi-C Interaction Frequency Curves for Specific
Regions (IFC)
An alternative approach to studying compaction is to examine the distribution of interaction distances made by regions. Normally we consider this for the entire genome, and a rough estimate of this curve is provided in the petag.FreqDistribution.txt file generated when the Hi-C Tag Directory is initially created. However, it can be useful to consider this interaction profile for specific regions instead the whole genome. For example, regions that are transcriptionally active, or have some other sort of phenotype of interest could be analyzed between experiments or compared relative to the rest of the genome.
To create interaction frequency curves (IFC), you can use analyzeHiC with the "-ifc <filename>" option. The key parameters for this analysis are the resolution/window sizes, and most importantly the regions you want to interrogate. Usually the regions will be specified in a peak/BED file ("-p <peak/BED file>"), but you can also specify contiguous regions using "-chr/-start/-end" or "-pos <chr:start-end>" options. If no regions are given, it will be assumed you want to generate curves for the whole genome.
analyzeHiC <HiCTagDir> -res <#> -window <#> -cpu <#> -p <peak/BED file> -vsGenome -nomatrix -ifc <outputFilename> [-chopify]This command will produce the output file "output.txt", which is a tab-delimited text file containing the distance and interaction frequencies. The first row will also record the interchromosomal interaction frequency as well.
analyzeHiC Exp1HiCTagDir/ -res 15000 -cpu 10 -p activeRegions.txt -vsGenome -nomatrix -ifc output.txt -chopify
One of the tricky parts of this command is how the regions are specified. First, in most cases, you have a set of regions of interest, and normally want to find how they interact with the rest of the genome. If you only specify the regions, analyzeHiC will look at the interactions between the regions (and not the rest of the genome). This is why you almost always want to include "-vsGenome" to the command. Also, you usually don't want to generate a GIANT contact matrix, so you almost always also want to include "-nomatrix".
Second, if peaks are provided HOMER will automatically analyze them relative to their center positions. This may be the desired behavior, say if you provided a list of transcription start sites (TSS) or CTCF peaks. However, if you provide regions (say domains, TADs, gene bodies, etc.), you may want to consider all of the interactions made along the regions (and not just at their midpoints). In this case you want to add the option "-chopify", which will subdivide these regions based on the resolution of the analysis so that their entire length is included.
Commandline options for subtractBedGraphs.pl
usage: subtractBedGraphs.pl <bedgraph
1> <bedgraph 2> [options]Options:
-cov <coverage bedGraph> (to remove regions with low/high coverage)
-name <bedgraph track name> (name for track, default: autogenerated)
-center (Center output on the mean of the bedGraph - remove global drift)
Commandline options for subtractBedGraphDirectory.pl
subtractBedGraphDirectory.pl
<HiCTagDir1> <HiCTagDir2> [options]Options:
-prefix <prefixName> (will separate bedGraphs based on this name)
-center (center bedGraphs on average signal, removes global differences)

Can't figure something out? Questions, comments, concerns, or other feedback:
cbenner@ucsd.edu