
HOMER
Software for motif discovery and next-sequencing analysis
HOMER2
HOMER2 extends the original HOMER software by
incorporating features that analyze how DNA motifs and other
sequence features exhibit positional enriched (or depletion)
within a set of sequences.HOMER2 adds to HOMER's DNA motif and sequence analysis capabilities in two new directions:
- First, HOMER2 expands the number of ways HOMER can consider background or control sequences when calculating DNA motif enrichment. Mainly, it can now randomly select from the genome or generate synthetic sequences that match positional k-mer content. This means that if your DNA sequences are anchored on a feature of interest, HOMER will attempt to account for lower-order (i.e. dinucleotide) sequence bias that might be present in your sequences. For example, if you have sequences centered on transcription start sites (TSS), certain nucleotides are likely to occur at certain positions, which may artificially increase the chance a given DNA motif will be recognized at that position. New background selection methods help address this concern, and provide tools to score the relative enrichment/depletion of motifs as a function of the motifs position in such sequences.
- Second, HOMER2 incorporates tools to help assess if DNA variants found at specific positions within a set of sequences tend to either enhance or diminish the predicted affinity of DNA motifs in association with a specific phenotype. For example, given two strains of mice and a set of TSSs that are specifically active in one strain versus the other, the program will assess if variants that enhance (or improve) the match for a given DNA motif are associated with an active (or inactive) phenotype.
Installation:
HOMER2 and related tools are integrated into HOMER starting with version v5. Please see the HOMER download/installation page for detailed instructions. Note: Most of the HOMER2 routines can work with BED/FASTA files and do not require the download of HOMER annotation related packages.Specific Tools in HOMER2
The following three sections describe useful tools that
are now part of HOMER2. One important note that applies to
all of these tools - the sequences you analyze must all
have the SAME LENGTH. The assumption
for positional enrichment is that all of your sequences
are anchored on some position or feature of interest such
that there is a relationship between nucleotide 1, 2, 3,
etc. across all of the input sequences.
homer2 background (basic tool to select or generate background sequences for sequence analysis tasks like motif enrichment)
createHomer2EnrichmentTable.pl (automate the creation of motif enrichment maps)
pacifierHomer2.pl (analysis of variants)
homer2 background
This is a utility program that is used by other programs within HOMER to generate the appropriate background sequences for analysis. Some programs in HOMER, like findMotifsGenome.pl and createHomer2EnrichmentTable.pl (below) use this program internally. However, if you want full control over how HOMER selects background sequences, you can use this tool directly. Furthermore, if you would like to use HOMER to generate background sequences for other applications or for use with other tools and analysis, you may want to use this tool directly as well.Choosing background sequences in HOMER/HOMER2 - this page contains a more detailed explanation of the homer2 background tool.
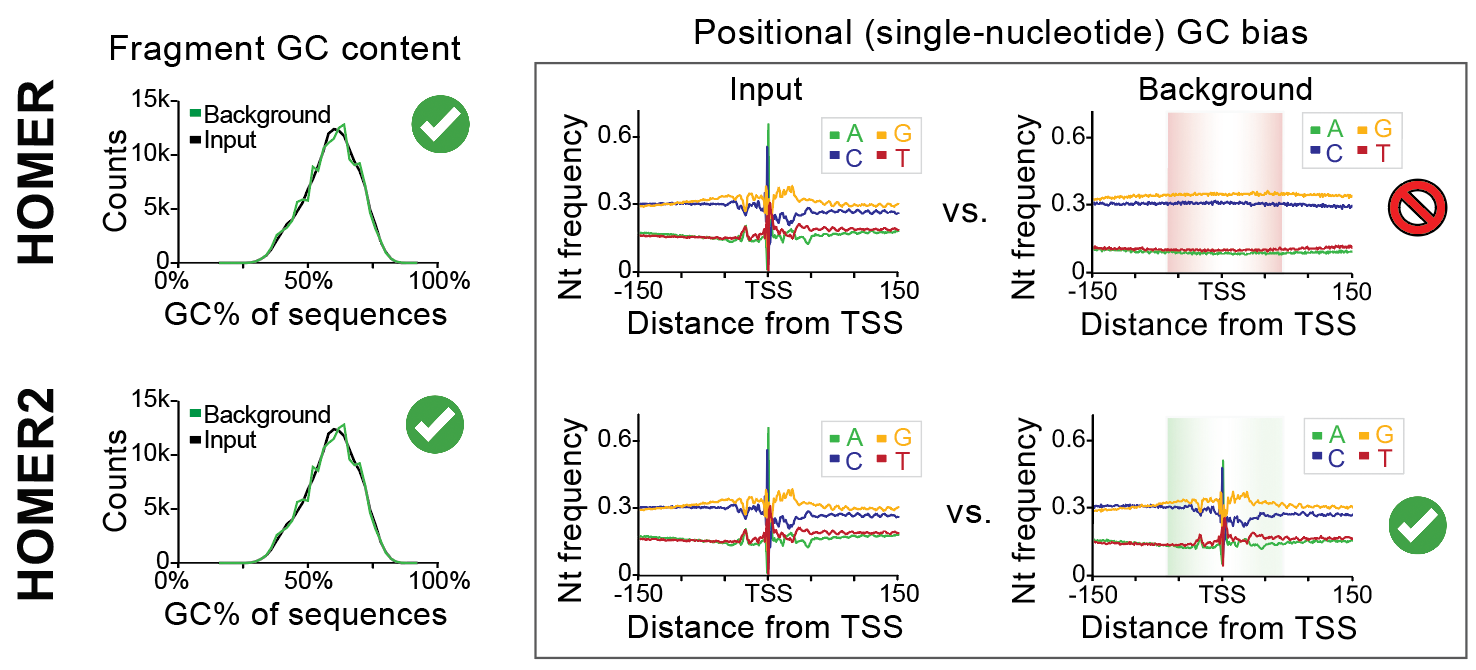
The basic idea is to select background sequences with similar position-specific sequence properties relative to your input/target sequences. Traditionally, HOMER only normalizes for GC content on a per-sequence basis, which helps control for the presence of sequences with extreme levels of GC nucleotides which are typically found in CpG Islands near vertebrate regulatory regions (e.g. promoters). With HOMER2, not only will homer control for the overall per-sequence GC%, it will also attempt to select (or model sequences) that contain similar lower-order nucleotide content (i.e. mononuclotides, dinucleotides, trinucleotides, etc.) at each position.
Key inputs and parameters:
- Input sequences (either genomic positions or a FASTA
file, MUST be the same length)
- Genome or other FASTA file to select background sequences from (technically optional as HOMER2 can create synthetic background sequences if desired).
- k = length of k-mer at each position to match sequence
properties with (k=1 nucleotides, k=2 dinucleotides, k=3
trinucleotides, etc.)
Sample Data:
- tss.positions.200.txt
- HOMER-style peak file similar to BED that contains
regions centered on 155k TSS locations identified by
csRNA-seq in U2OS cells in human [hg38]). The "200"
refers to the fact that the regions are 200 bp long
(centered on the TSS). Unzip it with gunzip before using
it.
- hg38.fa - you can download this directly from UCSC using "wget https://hgdownload.soe.ucsc.edu/goldenPath/hg38/bigZips/hg38.fa.gz" and then unzipping the file with gunzip
Example: This program will take ~5min and use ~16Gb of memory (if that is too much, try setting -NN 10000000 to only use ~8Gb):
homer2 bg -p tss.positions.200.txt -g hg38.fa -pkmer 2 -N 100000 -NN 100000000 -o output -allowTargetOverlap -allowBgOverlap
Output: The program will create several output files starting with <prefix> (set with -o <prefix>, in the case above it is 'output'):
- <prefix>.info.txt - reports the command line options used and some basic information including actual number of sequences in output background set and the cumulative 'difference' or error in the background sequence properties and the target set.
- <prefix>.bg.positions.bed - tab-delimited
BED format file with the genomic positions of all
selected sequences
- <prefix>.bg.sequences.fasta - FASTA
formatted file containing the selected background
sequences
- <prefix>.bg.stats.txt - table containing the name of the background sequence, chromosome, position (min regardless of strand), strand, weight (1.0, not used), Profile Score (internal score, not used), GC%, and the internal bin ID the background was assigned from.
- <prefix>.bg.positions.bed, <prefix>.bg.sequences.fasta,
and <prefix>.target.stats.txt provide the
same information, but for the target sequences.
The output sequences can then be use as controls for DNA motif finding, enrichment calculations, or other creative uses.
Note - there is a LOT more that this program can do to control how your background sequences are created. In particular, you can also use it to model potential background sequences instead of having them selected from the genome. See the background page for more information.
Usage:
homer2 background -i <target sequences.fasta> [options]
Generate/Select background sequences that match properties in a set of target sequences.
Inputs:
Target sequences you want to model:
-i <target sequences.fasta> (FASTA file)
-p <target positions.bed> (Alteratively, provide a BED or HOMER peak file with genomic coordinates)
Background sequences to select from:
-model (generate sequences using a model, do not extract real background sequences)
-g <genome.fasta> (genome FASTA file or seqeunce resource to select sequences from)
-b <background sequences.fasta> (explicit set of background sequences to choose from FASTA file)
-bg <background positions.bed> (explicit set of background positions to choose from)
-bgr <background regions positions.bed> (regions of the genome to select bg sequences from)
Key options:
-size <#> (size of regions to consider in background, default: avg of length of target sequences)
-N <#> (number of background sequences to select, default: 100000)
-NN <#> (number of background sequences initial screen from genome, default: 100000000)
-mask (mask lowercase sequence i.e. softmasked sequence, default: use all sequences)
-nbins <#> (number of bins to segregate sequences into for GC selection, def: 10
-nsubBins <#> (number of bins to segregate sequences into for positional frequencies, def: 10
-maxFractionN <#> (Maximum fraction of sequence that can be N and still used, default: 0.5)
-allowTargetOverlaps (allow selected bg sequences from a genome to overlap targets, def: not allowed)
-allowBgOverlaps (allow selected bg sequences from a genome to overlap, def: not allowed)
-strand (allow sequences to overlap if on separate strands)
-pkmer <#> (match positional kmer content)
-ikmer <#> (match overall kmer content [position independent])
-excludeNs/-includeNs (by default, kmers with Ns are excluded when selecting bg sequences,
but included when generating sequences with -model)
-pscore <outputBEDfile> (Report initial pscores)
-maxIterations <#> (maximum iterations, def: 20)
-overlapIteration <#> (iteration to start enforcing no overlaps, def: 5)
-decayRate <#> (selection rate per iteration, def: 0.75)
-seed <#> (seed for random number generator, def: uses time)
Output:
-o <output prefix> (default: out)
-gs (include homer-style group and sequence output files)
Important: You input sequences must be the same length!
createHomer2EnrichmentTable.pl
This tool helps calculate enrichment/depletion maps to better understand how specific DNA motifs are enriched in a position-dependent manner within a set of sequences. It will automatically call 'homer2 background' unless you explicitly provide background sequences. It will scan motifs across your target and background sequences and calculate the position-specific enrichment for each motif at each position. It can also perform other tasks, such as run de novo motif finding in a position specific-fashion.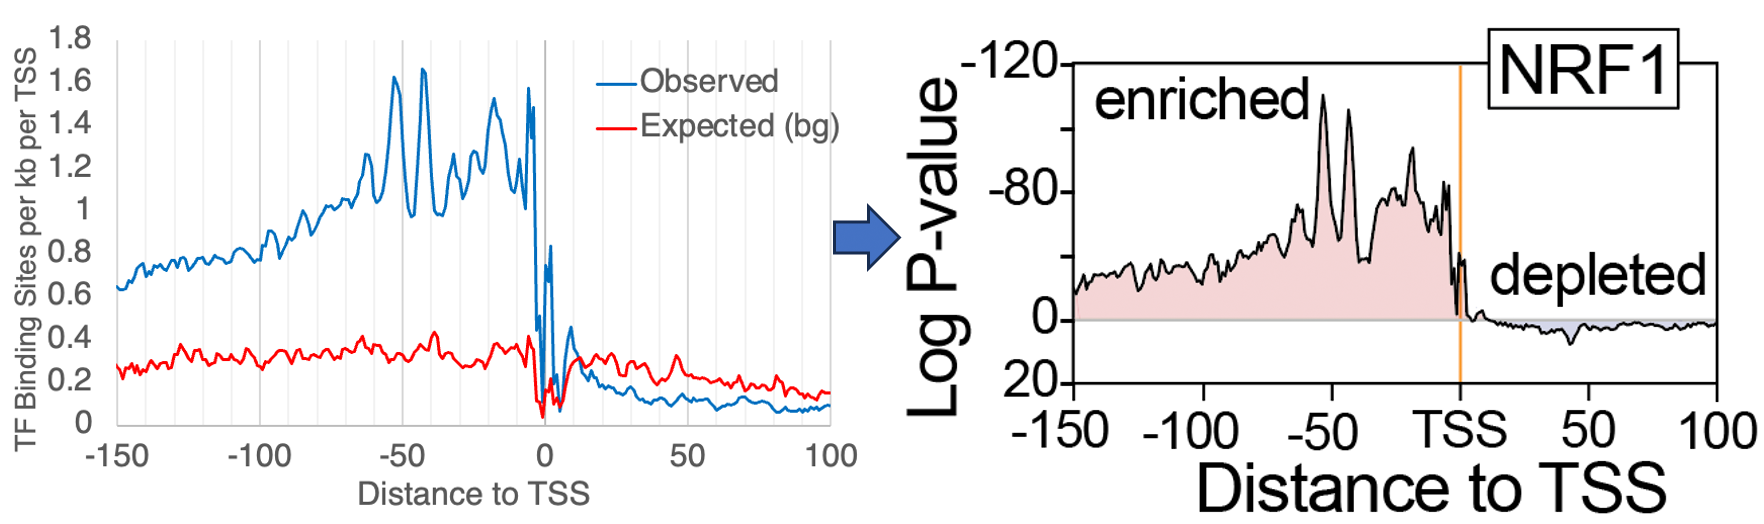
Key inputs and parameters:
- Input sequences (either genomic positions or a FASTA
file, MUST be the same length)
- Genome or other FASTA file to select background sequences from (technically optional as HOMER2 can create synthetic background sequences if desired).
- k = length of k-mer at each position to match sequence properties with (k=1 nucleotides, k=2 dinucleotides, k=3 trinucleotides, etc.)
- HOMER motif(s) file to analyze
Resolution of analysis: By default it will analyze motif
enrichment at each position using a 3bp window, but this
can be customized using the -windows, -regions, and
-positions arguments.
Sample Data:
- tss.positions.200.txt
- Same as above, HOMER-style peak file similar to BED
that contains regions centered on 155k TSS locations
identified by csRNA-seq in U2OS cells in human [hg38]).
The "200" refers to the fact that the regions are 200 bp
long (centered on the TSS). Unzip it with gunzip before
using it.
- hg38.fa - Same as above, you can download this directly from UCSC using "wget https://hgdownload.soe.ucsc.edu/goldenPath/hg38/bigZips/hg38.fa.gz" and then unzipping the file with gunzip.
- selected.motifs
- HOMER-style motif file containing several commonly
found motifs near TSS.
Example: This program will take ~15min and use ~16Gb of memory (if that is too much, try setting -NN 10000000 to only use ~8Gb):
createHomer2EnrichmentTable.pl -o outputDirectory/ -strand separate -m selected.motifs -p tss.positions.200.txt -g hg38.fa -size 400 -windows 3 -pkmer 2 -allowTargetOverlap -allowBgOverlap
Output: The program will create (if it doesn't already exist) a new output directory (specified by "-o <outputDirectory>") with several files:
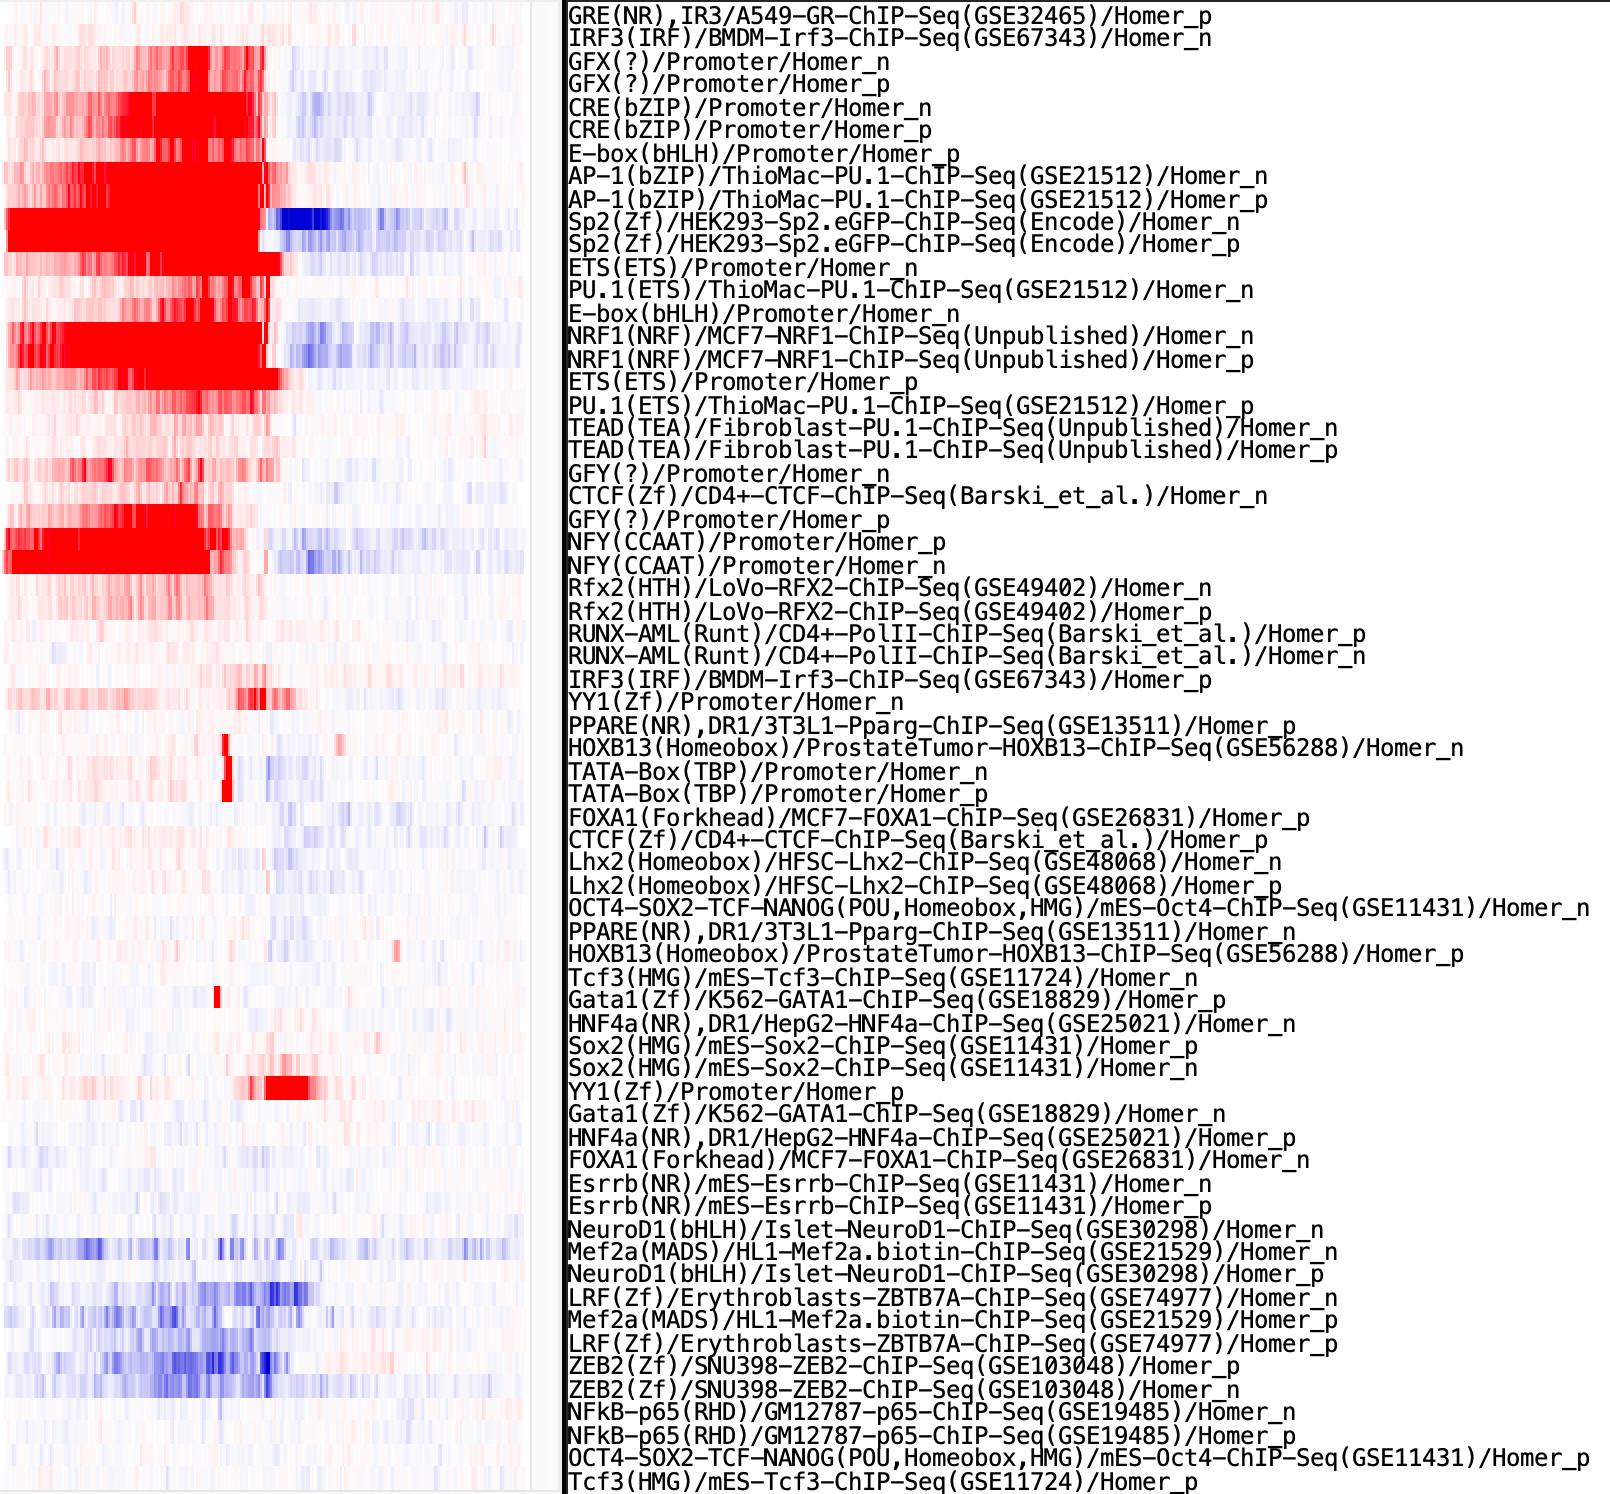
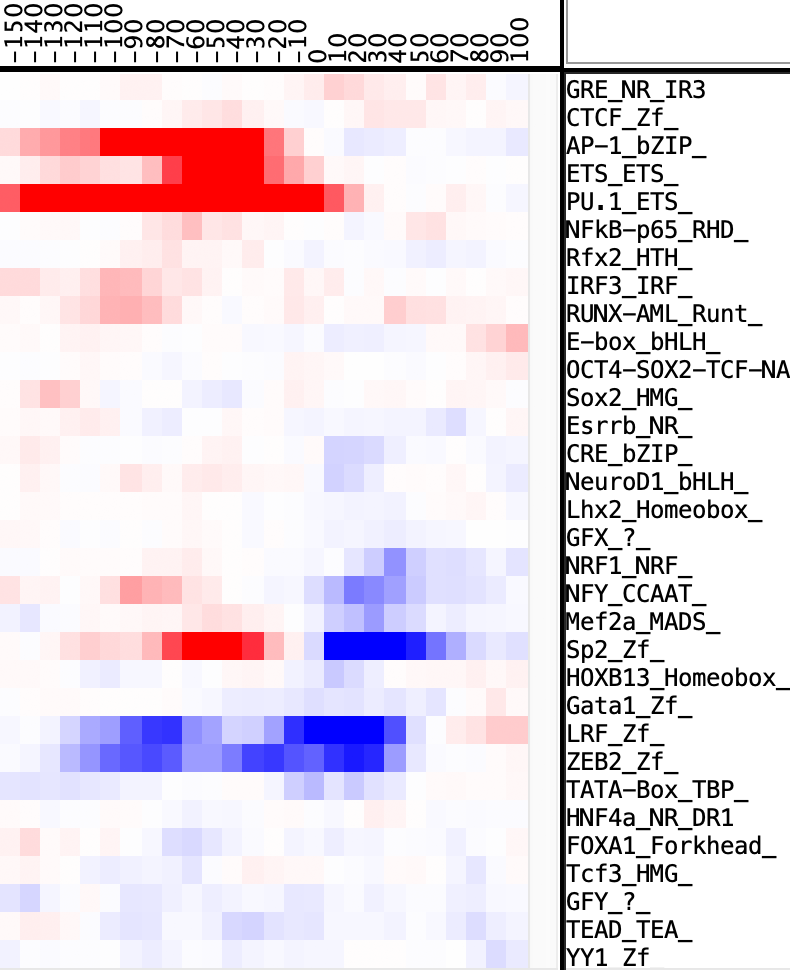
Note, the primary output file is summary.window3.logq.txt which described the positional enrichment of each motif (BH-corrected log10 q-values). These q-values are signed in the sense that positive log q-values imply positive enrichment, while negative q-values describe depletion of the motif relative to background at that position.
- cmd.txt - command line parameters used for the
analysis.
- homerBg.* - several output files corresponding
to the background selection that are generated by
'homer2 background' - see above.
- summary.windowN.logp.txt - natural log p-values for all motifs at each position evaluated with a given window size (default=3, i.e. +/- 1 bp).
- summary.windowN.logq.txt - base 10 log
q-values (BH adjusted), and flipped.
- summary.bestIntervals.txt - Reports the positions with the best enrichment and depletion
- summary.fourier.txt - power spectrum analysis
output for the interval [-120,-40] where we typically
observe helical preferences in motifs near mammalian
TSS.
- allmotifs.logp.txt - long form table that contains all of the enrichment data indexed by position and window size
- For each TF analyzed there are also specific files
that contain motif frequencies per position, logp, etc.
If motifs are analyzed for each strand separately, the
negative strand motifs often contain the suffix "_2".
Note - there are many other ways to run this program, including checking for enrichment at different resolutions and specifying different backgrounds.
createHomer2EnrichmentTable.pl
usage: createHomer2EnrichmentTable.pl [options]
Options:
-o <output directory> (required)
-strand <+|-|separate|both> (default, both)
-cpu <#> (number of CPUs to use, def: 56)
-cpu2 <#> (number of CPUs to per HOMER denovo analysis, def: 30)
Profiling enrichment of known/given motifs:
-m <motif file>
Finding motifs de novo
-denovo (look for motifs)
-len <#> (length of motif to find, def: 10)
-S <#> (number of de novo motifs to find, def: 5)
Enrichment regions:
-all (check all positions at all resolutions)
-regions <#,#> [#,#] ... (regions to search for enriched motifs)
-windows <#>[,#,#,...] | -wstart <#>, -wend <#>, -wstep <#> (size of enrichment region)
-positions <#>[,#,#,...] | -pstart <#>, -pend <#>, -pstep <#> (location of enrichment region)
Target Sequences:
-p <peak/BED file> (i.e. tss positions)
-g <genome FASTA file>
-size <#> (resize regions to this size, -size #,# ok to use)
-mask (use repeat masked sequences)
-maxN <#> (Maximum fraction of Ns in sequence to still consider in analysis, default=0.5)
-or-
-tg <fasta file> (target sequences in FASTA format)
-offset <#> (offset of fasta sequences for reporting, default: default)
Control Sequences:
-pkmer <#> (length of kmers to model sequence properties with by position, default: 2)
-ikmer <#> (length of kmers to model sequence properties with independent of postiion intsead)
-model (intead of using actual sequences, generate random sequences matching the desired kmer content)
-nbins <#> (number of GC bins to stratify sequences by, def: 10)
-nsubBins <#> (number of sub bins used to help stratify kmer content, def: 10)
-allowTargetOverlap (allow background regions to overlap target regions, by default not allowed)
-allowBgOverlap (allow background regions to overlap with other background regions, by default not allowed)
-N <#> (number of random sequences, def: same as target sequence set)
-NN <#> (number of initial sequences to extract from genome for selection, def: 100000000)
-or- (these options will be used 'as is' and not normalized)
-bg <fasta file> (background sequences in FASTA format)
-bgp <peak/BED file> (background positions)
Other options:
-fourierRange <#>,<#> (region to calculate frequency spectrum on, defaut: -120,-40)
-calcSeqProperties (calculate sequence nucletodie pattern rates)
Notes:
-enrichment values are returned as natural log p values, where '+' values indicate depletion
pacifierHomer2.pl
This program attempts to associate single nucleotide variants (SNVs) found in the context of transcription factor binding sites to changes in the activity of nearby transcription initiation sites. For a given TF motif found at a specific interval away from a set of regulated features (e.g. TSSs), it will calculate the distribution of changes in motif log-odds scores associated with increased activity. The null hypothesis is that a give TF has no impact on transcription regulation, such that we expect changes in motif scores to be ~zero. Of course, there are many biases in the data that make this expectation false, which this program attempts to address which is uses to build an 'expected' distribution in motif changes. The program then uses a non-parametric Mann-Whitney U test to calculate a significance score, which is subsequently adjusted for multiple hypothesis testing (BH-corrected).There are many ways to run this program, but at its core it wants 4 files/pieces of information:
- Genome or other FASTA file to extract sequences from.
- HOMER motif(s) file to analyze
- Features file that specifies the positions of the anchor features (i.e. TSS positions) used in the analysis
- QTL file that specifies the location of variants along
with information about how they relate to nearby
features (i.e. are they associated with an active or
repressive phenotype).
In practice, depending on what you're doing, it's best to think about how you can create a "Features" and "QTL" file for use with the program. There are ways to use a VCF along with regulated feature files below, but since that doesn't fit all situations, you may need to parse your data to work within the "Features" and "QTL" files described here:
Features File: This one is pretty simple, it should look like a tab-delimited HOMER peak file (more or less a bed file with column 1 being a unique identifier for the feature):
#phenotype_id chr start end strand
TSS-25650 chr1 46832095 46832095 -
TSS-122421 chr4 8911871 8911871 -
TSS-16113 chr2 148487278 148487278 +
...
QTL File: This is more complicated. The first column should show the variant (encoded by chr_position_ref_alt), the featureID (or phenotype_id), the relative distance of the feature, and then columns specifying information about the number of samples with the variant, total samples in the analysis, MAF of the variant, the p-value (if it a proper QTL analysis), and the slope. The slope is IMPORTANT - this specifies whether the variant is positively or negatively associated with the feature, and should be either a positive(+) or negative(-) value. The other parameters and relative value of the slope are not important, other than the program offers some control over filtering the table based on these values if they are present (i.e. if you want to run the analysis using only variant/qtls with specific scores).
#variant_id phenotype_id tss_distance na_count na_samples maf pvalue slope
chr4_155831915_T_C TSS-115727 216 NA NA NA NA 1
chr13_63431468_C_G TSS-69313 -236 NA NA NA NA -1
chr8_33641917_C_A TSS-189725 -75 NA NA NA NA -1
...
pacifierHomer2.pl will also parse a VCF file to generate these files for you. For this you will need to the VCF file, and then two feature files (i.e. centered on TSS positions of interest) that represent features specifically active in the reference and features specifically active in the alternates. For example, in this example we are comparing C57Bl/6 and SPRET mice (two different strains), so we provide a VCF file that contains the SPRET variants (C57Bl/6 is the reference), and then two files containing the positions of the TSS that are more active in C57 and one with positions of TSS that are more active in SPRET. After the program is done running, there will be two files in the output folder called "qtlFeatures.tsv" and "qtls.tsv" which represent the two needed files above and can be used for subsequent analyses to speed things up (since the program won't need to match up TSS and variants again).
Example using a VCF and two regulation files (tss.UpC57.txt, tss.UpSPRET.txt).
pacifierHomer2.pl -g1 genomes/mm10.fa -vcf SPRET_EiJ.mgp.v5.snpsAndIndels.dbSNP142.filtered.mm10.vcf -p1 tss.UpC57.txt -p2 tss.UpSPRET.txt -start -200 -end 200 -step 10 -window 30 -m selected.motifs -o outputDirectory -snvOnly
Files to easily run the program again will be in outputDirectory/qtlFeatures.tsv and outputDirectory/qtls.tsv
Sample Data:
- mm10.fa - Similar to above, you can download this directly from UCSC using "wget https://hgdownload.soe.ucsc.edu/goldenPath/mm10/bigZips/mm10.fa.gz" and then unzipping the file with gunzip.
- selected.motifs - HOMER-style motif file containing several commonly found motifs near TSS.
- qtls.tsv - QTL file based on C57 and SPRET strain-specific TSS found in mouse macrophages
- qtlFeatures.tsv -
Features file corresponding to the qtls.tsv file above.
Example: This program will take ~2 hr and use ~1.5Gb memory per CPU (parallelization works at the level of motifs - each will get it's own process):
pacifierHomer2.pl -g1 mm10.fa -qtl qtls.tsv -peaks qtlFeatures.tsv -m selected.motifs -o outputDirectory
Output: The program will create (if it doesn't already exist) a new output directory (specified by "-o <outputDirectory>") with several files:
Note, the primary output file is fdr.table.txt which described the positional enrichment of each motif (BH-corrected log10 q-values). These q-values are signed in the sense that positive log q-values imply that mutations that strengthen the motif are associated with activation (positive phenotypes), while negative log q-values describe imply mutations that strengthen the motif match are associated with repression (negative phenotypes).
- log.txt - command line parameters used for the
analysis, along with some other parameters and filtering
information.
- logp.table.txt - log10 p-values for all motifs at each position evaluated scored against the expected background.
- logp0.table.txt - log10 p-values for all motifs at each position evaluated scored against the expectation that the change in motif scores should be zero.
- fdr.table.txt - log10 q-values for all motifs at each position evaluated scored against the expected background (BH-corrected).
- fdr0.table.txt - log10 q-values for all motifs at each position evaluated scored against the expectation that the change in motif scores should be zero (BH-corrected).
- scoreDiff.table.txt - Average difference in motif log odds score for each motif at each position.
- stats.tfs.txt - long form table that records the analysis results of each motif across each interval, reporting p-values, motif score differences, number of sites, etc.
- variantSummary.tsv - counts for each SNV change at each position in the data set (i.e. number of A->C changes at position -24).
- mutatedSites.txt - table of all mutated motifs, including positions, scores, sequences, etc.
- TF specific folders: Each TF will have it's own
folder with motif specific information that is also
summarized in the files above.
If you are wondering why the name starts with pacifier... this came about because the program was originally a wrapper for running Maggie, which is where the program borrowed its strategy for variant/motif/phenotype association testing.
pacifierHomer2.pl usage:
pacifierHomer2.pl <genotype/phenotype/size inputs> <-m motifFile> <options>
If using two genomes linked with liftOver files:
-g1 <genome fasta file for 1st strain>
-g2 <genome fasta file for 2nd strain>
-liftOver <1st to 2nd genome liftOver file, unzipped>
-p1 <regions with specific phenotype to 1st strain (coord. based on genome1)>
-p2 <regions with specific phenotype in 2nd strain (coord. also based on genome1)>
-allowN (by default, homolgous regions with different number of Ns are discarded)
If using VCF file and peak files with regions of interest:
-g1 <genome fasta file for genome>
-vcf <vcf file with variants>
(filters, column specification?)
-p1 <regions with specific phenotype for reference alleles>
-p2 <regions with specific phenotype in alternate allele>
If using QTL file and peak files with regions of interest:
-g1 <genome fasta file for genome>
-qtl <QTL mapping file>
-pvalueThreshold <#> (default: 1)
-absSlopeMin <#> (default: -1e+100)
-mafThreshold <#> (default: 0.05)
-flipScore (treat negative scores as 'up' in the Alternate allele)
-peaks <QTL feature position - peak/BED file>
--- General Options ---
Specifying distance size intervals to analyze:
-size <#,#> [#,#] [#,#] (region(s) to analyze)
-or-
-start <#> (default: -150)
-end <#> (default: 150)
-step <#> (default: 10)
-window <#> (default: 30)
Motif options:
-m <motif(s)> (required, analyzed sequences must contain this motif)
-adjustMotifThreshold <#> (change all motif logodds thresholds by this)
Varients to consider (vcf/qtl analysis only, won't work with liftOver analysis):
-snvOnly | -allVariants (do not consider indels, default, or consider everything [may not work will all options])
-indelsOnly (only consider indels, not snvs)
-subset (only consider these variants)
Output:
-o <output directory> (required)
Other options:
-strand <.|+|-> (default, "." for both)
-cpu <#cpus> (number of CPUs/threads for interval analysis, def: 56)
-p <#cpus> (number of CPUs per interval i.e. number of motifs to analyze in parallel, def: 10)
-pp <#cpus> (number of CPUs for sequence generation, liftover, def: 50)
-gwas <gwasCatalog.txt> (will annotate variant results associated with GWAS hits)
-mask (use repeatmasked sequences for analysis)
-randomize (Randomize variant assignments to features)
-motifOrder <#> (when randomizing motif, 0(def)=swap columsn, 1=try to preserve dinuc, 2=trinuc)
-markov <#> (Markov order for randomization, add an i for position independent model e.g. "-markov 2i", def: 1)
-rps <#> (randomizations per sequence, default: 5)
-loadExistingRandomizations <filename> (skip model generation and randomization)

Can't figure something out? Questions, comments, concerns, or other feedback:
cbenner@ucsd.edu