
HOMER
Software for motif discovery and next-gen sequencing analysis
Finding TADs and Loops with HOMER
HOMER has updated how it looks for loops and topological
associated domains (TADs) from previous versions to be
more robust, and to address how to identify confidently
changing loops between different conditions. Chromatin
loops (previously referred to as 'significant
interactions'), represent two regions that interact at a
high frequency with one another. On a Hi-C contact map,
these show up as dots/points. TADs, on the other hand, are
domains of chromatin that make interactions within
themselves at a higher rate than with their surrounding
chromatin, and look like 'triangles' on a Hi-C contact
map. The two are often related in the sense that a loop is
often at the apex of the TAD.
Quick Reference
#analyzing TADs and loops (i.e. specific locations that interact, e.g. two CTCF sites interacting):
findTADsAndLoops.pl find HicExp1TagDir/ -cpu 10 -res 3000 -window 15000 -genome hg38 -p badRegions.bed
#This will create *.loop.2D.bed and *.tad.2D.bed files and place them within the tag directory. Even better to include a list of segmental duplications/blacklisted regions with "-p <peak/BED file>" to filter out likely false positives. The 2D.bed files can be visualized with Juicebox.
#To analyze changes in TAD/Loops across experiments, first merge features that you want to analyze from each experiment to get the union of features to analyze
merge2Dbed.pl exp1.loop.2D.bed exp2.loop.2D.bed -loop > merged.loop.2D.bed
merge2Dbed.pl exp1.tad.2D.bed exp2.tad.2D.bed -tad > merged.tad.2D.bed
#Once features have been merged, next quantify them across all replicates/experimental conditions (computes stats for loops and TADs at the same time)
findTADsAndLoops.pl score -tad merged.tad.2D.bed -loop merged.loop.2D.bed -o outPrefix -d HicExp1r1TagDir/ HicExp1r2TagDir/ HicExp2r1TagDir/ HicExp2r2TagDir/ -cpu 10 -res 3000 -window 15000
#Finally, identify features that are differentially enriched (uses edgeR/limma):
getDiffExpression.pl outPrefix.loop.scores.txt exp1 exp1 exp2 exp2 -loop > output.loop.txt
getDiffExpression.pl outPrefix.tad.scores.txt exp1 exp1 exp2 exp2 -tad > output.tad.txt
Finding TADs and Loops with HOMER
TADs and Loops are found simultaneously with HOMER using the creatively named command findTADsAndLoops.pl. This command works by generating relative contact matrices for each chromosome and scanning them for locally dense regions of contacts (i.e. loops) or triangle domains that have a high degree of inter-domain interactions relative to their surrounding region. Once these features have been identified, the command can be used again to score these regions across several experiments to identify differential features (covered in the next section). This process can take a while, but HOMER can speed it up by analyzing each chromosome using a separate process (of course, chr1 will take the longest still...).
The findTADsAndLoops.pl command has two modes. The first one is "find" which is covered here, which is used to identify features in the Hi-C experiment. The find command runs 3 sub-programs to identify features:
If there are regions you know might cause problems (i.e. regions with known segmental duplications), it's a great idea to pass these to findTADsAndLoops.pl with the "-p <peak/BED file>" option. Segmental duplications are often sites where read mapping anomalies occur. To generate a file for this purpose, I would recommend downloading the genomicSuperDups.txt.gz file from the UCSC annotation database for the organism you're studying. It's also worth downloading the gaps.txt.gz file while you're at it:
- Generate relative contact maps for each chromosome (using analyzeHiC)
- Analyzes the contact maps to identify TADs/Loops (using findTADsAndLoopsFromRelMatrix)
- Filters the final TAD/Loop calls to remove likely artifacts (low coverage regions and features near segmental duplications, using filterTADsAndLoops.pl).
wget -O gap.txt.gz http://hgdownload.soe.ucsc.edu/goldenPath/hg38/database/gap.txt.gzTo actually find Loops and TADs, the command takes the following form:
wget -O dups.txt.gz http://hgdownload.soe.ucsc.edu/goldenPath/hg38/database/genomicSuperDups.txt.gz
zcat gap.txt.gz dups.txt.gz | cut -f2-4 > badRegions.bed
Make sure to use the correct genome!!! (this example uses hg38) Now you can use "-p badRegions.bed" with the findTADsAndLoops.pl
findTADsAndLoops.pl find <HiC tag directory> -res <#> -window <#> -genome <version> -p <peak/BED file for bad regions> -o <outputPrefix>After completion, the program will generate two *.2D.bed files containing the TADs and Loops. If no output file prefix is given with "-o <outputPrefix>", the output files will be placed inside the tag directory. The program will also generate two bedGraph files that describe the directionality index (i.e. preference for a region to interact either upstream or downstream of its current position) and the insulation score.
findTADsAndLoops.pl find HicExp1TagDir/ -cpu 10 -res 3000 -window 15000 -genome hg38 -p badRegions.bed
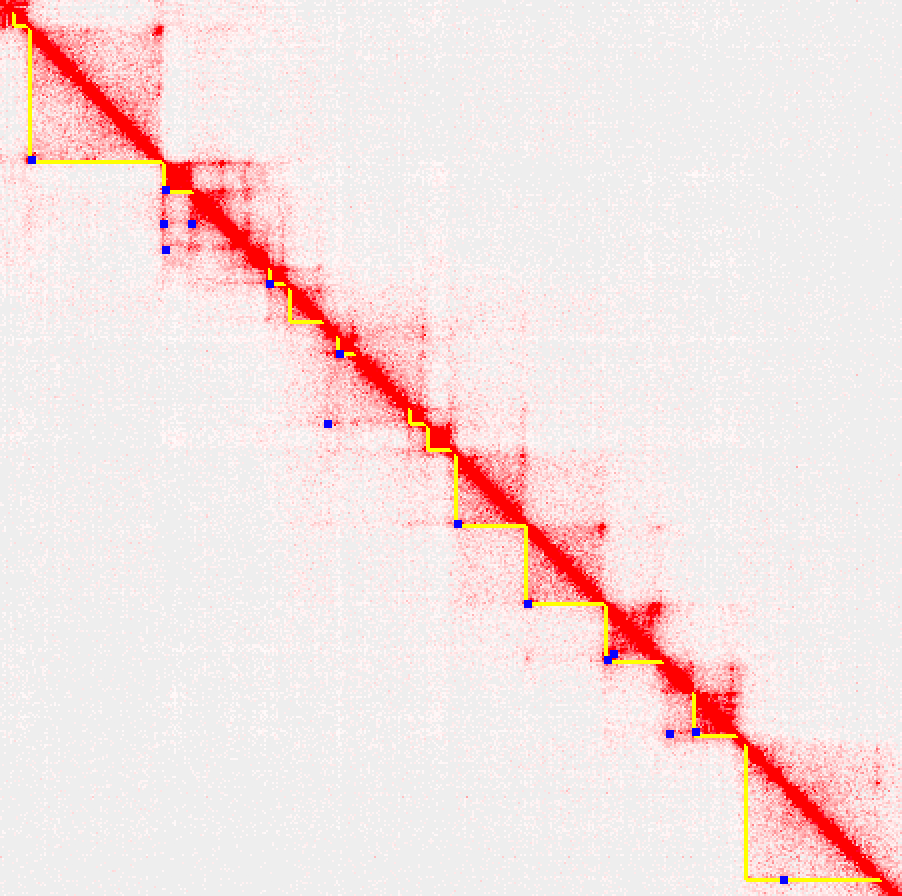
The 2D.bed files can be further analyzed in the context of other experiments to identify differential structural features (described below). They are also compatible with other tools, such as Juicebox. You can load them them as 2D annotations using Juicebox's annotation panel (2D annotations-> load Loops/Domains). An example of loading these annotations is shown below (note: this example only displays the features on 'half' of the contact map so that you can see the interaction density on the other half):
Scoring Loops and TADs
Loops are scored by their Hi-C interaction density, which is normalized to the read depth, but otherwise will NOT be normalized by area or total read counts. This is so that these values can be treated later as read-count data for analysis with tools like DESeq2/edgeR.
In contrast, TADs are scored by an inclusion ratio (IR), which represents the ratio of intra-TAD interactions relative to interactions from the TAD to the surrounding region (both upstream and downstream of the TAD to regions the same size as the TAD). The interactions rate is averaged across distances, summed, and then the ratio is calculated. High IR indicates a dense triangle that makes few interactions to adjacent regions, while low IR values indicate a lack of TAD. It is also important to note that HOMER looks for TADs by optimizing IR values, taking the optimum regions and discarding overlapping TAD calls. It also uses an IR threshold when considering TADs, and does not force all regions of the genome to be part of a TAD.
Identifying Differentially regulated TADs and Loops
As with almost all differential analysis with NGS data, finding differential structural features follows a similar pattern:
- Identify features of interest (i.e. TADs/Loops) across all experiments
- Merge features into a union of all features
- Quantify the features across all experiments
- Find features with statistically significant differences across experiments
Once you find TADs/Loops across all of your experiments (as describe in the section above), you can merge them into a common set of features using merge2Dbed.pl (This example assumes two experimental conditions with two replicates each):
merge2Dbed.pl <2D bed file1> <2D bed file2> [2D bed file3] ... > output.2D.bedNow that we have merged files containing the loops and TADs across all of the experiments, it's time to quantify each of the features across all experiments. To score each feature, rerun the findTADsAndLoops.pl command in 'score' mode (i.e. first argument is 'score'), supplying the merged TAD and Loop files and the Hi-C Tag Directories that you want to quantify:
merge2Dbed.pl exp1r1.loop.2D.bed exp1r2.loop.2D.bed exp21.loop.2D.bed exp2r2.loop.2D.bed -loop > merged.loop.2D.bed
merge2Dbed.pl exp1r1.tad.2D.bed exp1r2.tad.2D.bed exp21.tad.2D.bed exp2r2.tad.2D.bed -tad > merged.tad.2D.bed
findTADsAndLoops.pl score -tad <tad.2D.bed> -loop <loop.2D.bed> -d <tagDir1> [tagDir2] -cpu <#> -o <outputPrefix>This command will produce two output files: output.loop.scores.txt and output.tad.scores.txt. These files are like 2D bed files (i.e. columns 2-9 compose the primary columns of a 2D bed file), but contain a feature ID in the first column and have extra columns for each Hi-C tag directory experiment quantifying the feature. To identify differentially regulated loops, these files can be analyze with the getDiffExpression.pl script, which acts as a wrapper for DESeq2/edgeR/limma to perform differential calculations
findTADsAndLoops.pl score -tad merged.tad.2D.bed -loop merged.loop.2D.bed -d HicExp1r1TagDir/ HicExp1r1TagDir/ HicExp1r1TagDir/ HicExp1r1TagDir/ -cpu 10 -o output
getDiffExpression.pl output.loop.scores.txt exp1 exp1 exp2 exp2 > output.diff.loop.txt
getDiffExpression.pl output.tad.scores.txt exp1 exp1 exp2 exp2 > output.diff.tad.txt
Command line options for findTADsAndLoops.pl
findTADsAndLoops.pl <cmd> [options]
Usage Modes:
findTADsAndLoops.pl find <tagDir> [options]
Finds TADs and Loops in the given Hi-C tag directory.
Output files
will have the same prefix, and include 2D bed files
specifying the locations of the features.
findTADsAndLoops.pl score -tad <tad.2D.bed> -loop
<loop.2D.bed> -d <tagDir1> [tagDir2] ...
[options]
Scores TADs and Loops cross several Hi-C tag directories
so that they can be compared across
different replicates and experimental conditions.
Note: When comparing experiments, it is recommended to
find TADs/Loops on individual experiments first,
then merge the features with merge2Dbed.pl, then 'score'
the commbined features across multiple tagDirs
Common Options:
-cpu <#> (max CPUs to use)
-res <#> (resolution, default: 3000)
-window <#> (overlapping window size, i.e. superRes,
default: 15000)
-balance | -nobalance (balance contact maps, default:
-balance)
-minDist <#> (minimum interaction distance to
consider, default: 25000)
-maxDist <#> (maximum interaction distance to
consider, default: 2000000)
Options
specific to 'find' mode:
-o <output prefix> (by default will place output
files within the Tag Directory)
TAD options:
-minTADsize <#> (default: 45000)
-minTADscore <#> (minimum inclusion score to call
TAD, default: 1.5)
-keepOverlappingTADs (by default, program removes
overlapping TAD calls)
Loop options:
-foldLoopLocalBg <#> (fold threshold for local loop
enrichment, default: 1.5)
-foldLoopGlobalBg <#> (fold threshold over avg.
interactions of similar distance, default: 2)
-poissonLoopLocalBg <#> (poisson p-value threshold
for differential interactions per loop, default: 0.01)
-poissonLoopGlobalBg <#> (poisson p-value threshold
for minimum interactions per loop, default: 1e-05)
Advanced options (probably best to avoid changing):
-minLoopDist <#> (minimum length of contact points
to find, default: 3x window size)
-anchorSize <#> (size of region used to calculate
loop score, default: window size)
-anchorLocalBgSize <#> (size of region used to
calculate local bg, default: 5x window size)
-minLoopReads <#> (minimum number of adjusted reads
for contact point, default: use -poissonLoopGlobalBg)
Artifact filtering options: (runs filterTADsAndLoops.pl)
-skipFiltering (skip post-feature finding filtering step)
-p <peak/BED file> (File of genome
duplications/bad/blacklisted regions to exclude from
Loop/TAD endpoints)
-genome <genome version> (i.e. hg19, hg38)
-badChr <chr> [chr] ... (chromosomes to
skip/exclude)
-minCoverageTAD <#> (minimum ratio of read coverage
in TAD relative to genome average, def: 0.25)
-minCoverageAnchor <#> (minimum ratio of read
coverage at anchors relative to average, def: 0.25)
Other options:
-insDist <#> (distance across which to calculate
insulation ratio, default: 150000)
-diDist <#> (distance across which to calculate
directionality index , default: 1000000)
-override (if res/maxDist are set to produce huge matrices
and you have the RAM, you may need to include this)
Options
specific to 'score' mode:
-o <output prefix> (default: "score")
-d <HiC TagDir1> [HiC TagDir2] ...
-loop <loop 2D BED file> (will score loop
interaction rates from this file)
-tad <tad 2D BED file> (will score TAD inclusion
ratios from this file)
Loop score reporting: (default: Hi-C depth normalized
counts [use for use with getDiffExpression.pl...])
-raw (report raw interaction counts, will impact TAD
inclusion ratio scoring too)
-normTotal <#> (normalize based on this depth of
sequencing for Hi-C experiments)
Command line options for filterTADsAndLoops.pl
filterTADsAndLoops.pl [options] -loop <Loop 2D bed>
-tad <TAD 2D bed> -d <tagDir> -genome
<genome> -o <outPrefix>
Paramters: (no
strict order needed)
-o <prefix for output files> (def: out)
-loop <loop 2D bed> (input loop file, 2D BED format)
-tad <TAD 2D bed> (input TAD file, 2D BED format)
-d <Hi-C tag dirctory> [tagdir2] ... (Used to
calculate experiment coverage)
-cpu <#> (number of processes to use to count reads
in multiple tagdirs at once)
-genome <genome version> (genome version, def: none)
** -p <peak/BED file of
duplication/bad/blacklist regions> (def: gaps/segDup
from UCSC)
-badChr <chr> [chr] ... (chromosomes to skip e.g.
chrY, def: none)
Thresholds:
-res <#> (resolution for interaction/region overlap,
def: 15000)
-minTADir <#> (minimum TAD inclusion ratio, def: 0)
-minLoopScore <#> (minimum int score, def: 0)
-minCoverageTAD <#> (minimum TAD coverage ratio
relative to average, def: 0.25)
-minCoverageAnchor <#> (minimum int coverage ratio
relative to average, def: 0.25)
co-filter score
files:
-TADscore <TAD score file>
-LoopScore <loop score file>
** Notes on -p
<peak/BED bad regions>:
Recommend to use genome assembly gaps and known duplicated
regions. To get these if you're using a UCSC
annotated genome, try something like the following to
create BED file with these regions (for hg38):
wget -O gap.txt.gz
http://hgdownload.soe.ucsc.edu/goldenPath/hg38/database/gap.txt.gz
wget -O dups.txt.gz
http://hgdownload.soe.ucsc.edu/goldenPath/hg38/database/genomicSuperDups.txt.gz
zcat gap.txt.gz dups.txt.gz | cut -f2-4 >
badRegions.bed
(then use "badRegions.bed" with the -p option)
Note that depending on the genome, UCSC might have
different file names...
Command line options for merge2Dbed.pl
merge2Dbed.pl
[options] <2D BED file1> <2D BED file2> [2D
BED file3]...
Options:
-res <#> (maximum distance between endpoints to
merge, default: 15000)
Usually for loops -res should be set to the
window/superRes size, for TADs 2x window/superRes
-loop (treat 2D bed input files as loops, default)
-tad (treat 2D bed input files as TADs)
-prefix <filePrefix> (output venn diagram overlaps
to separate files)

Can't figure something out? Questions, comments, concerns, or other feedback:
cbenner@ucsd.edu